Innovation Carnival Maps
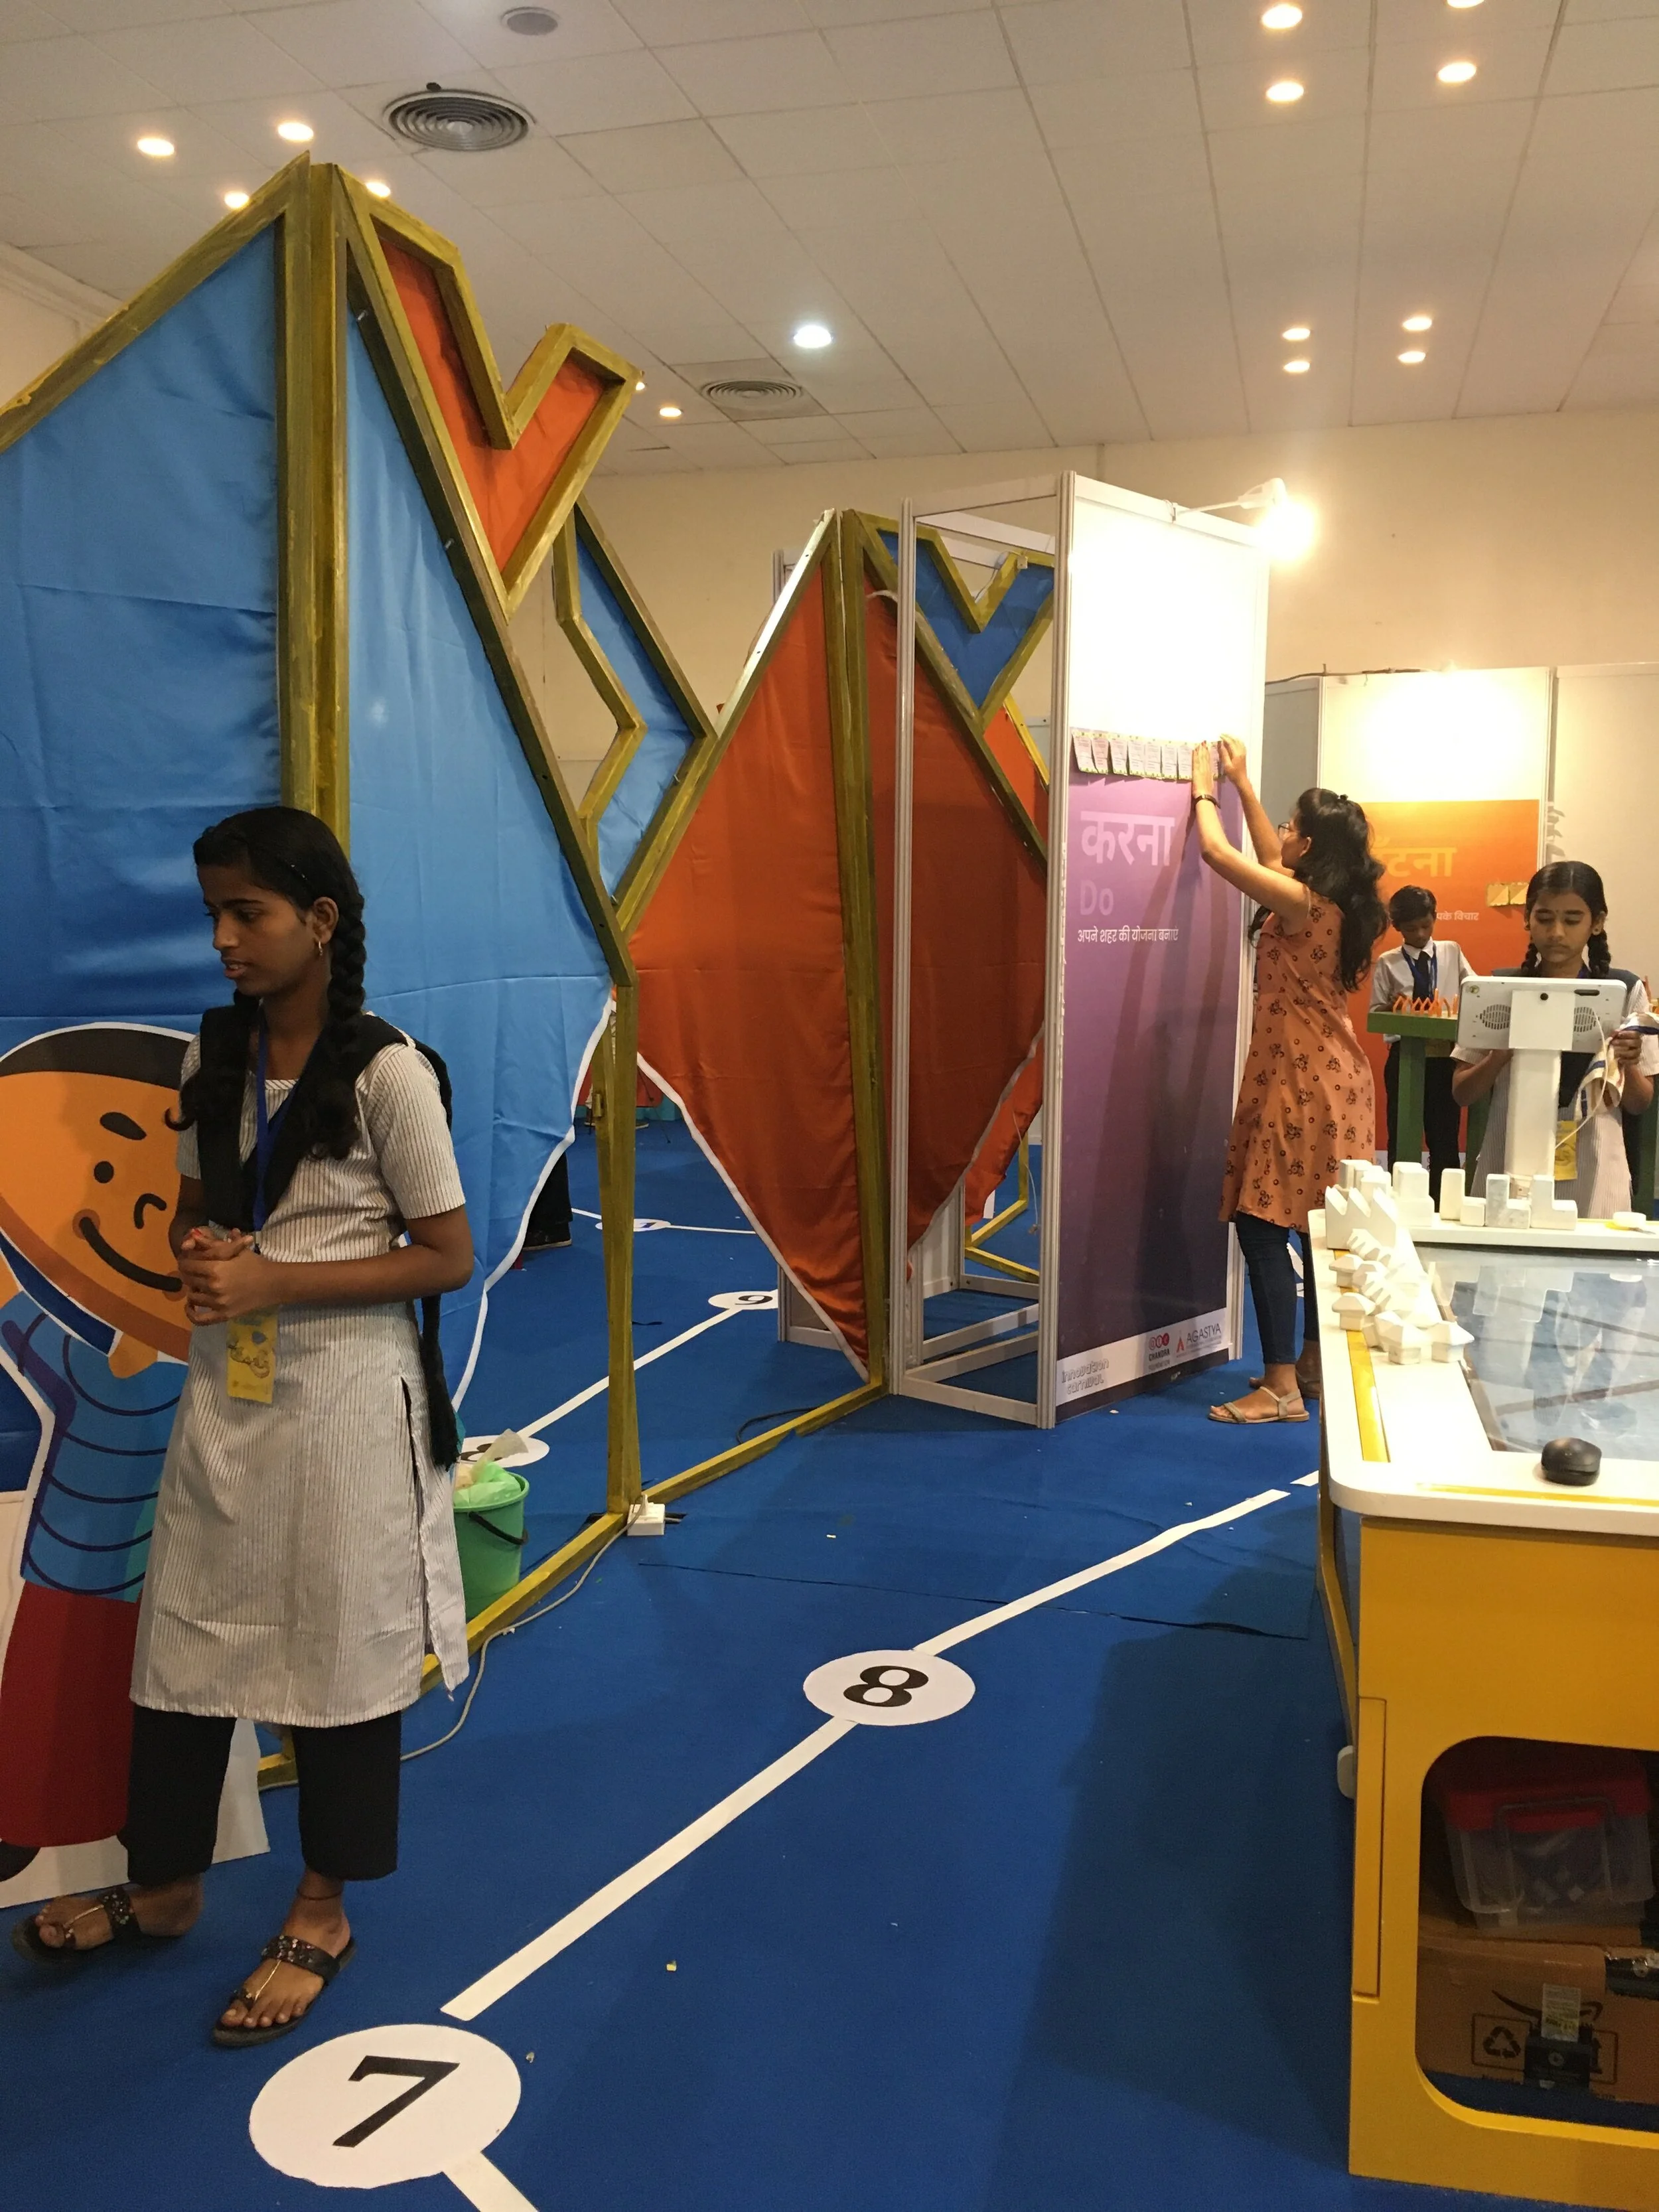
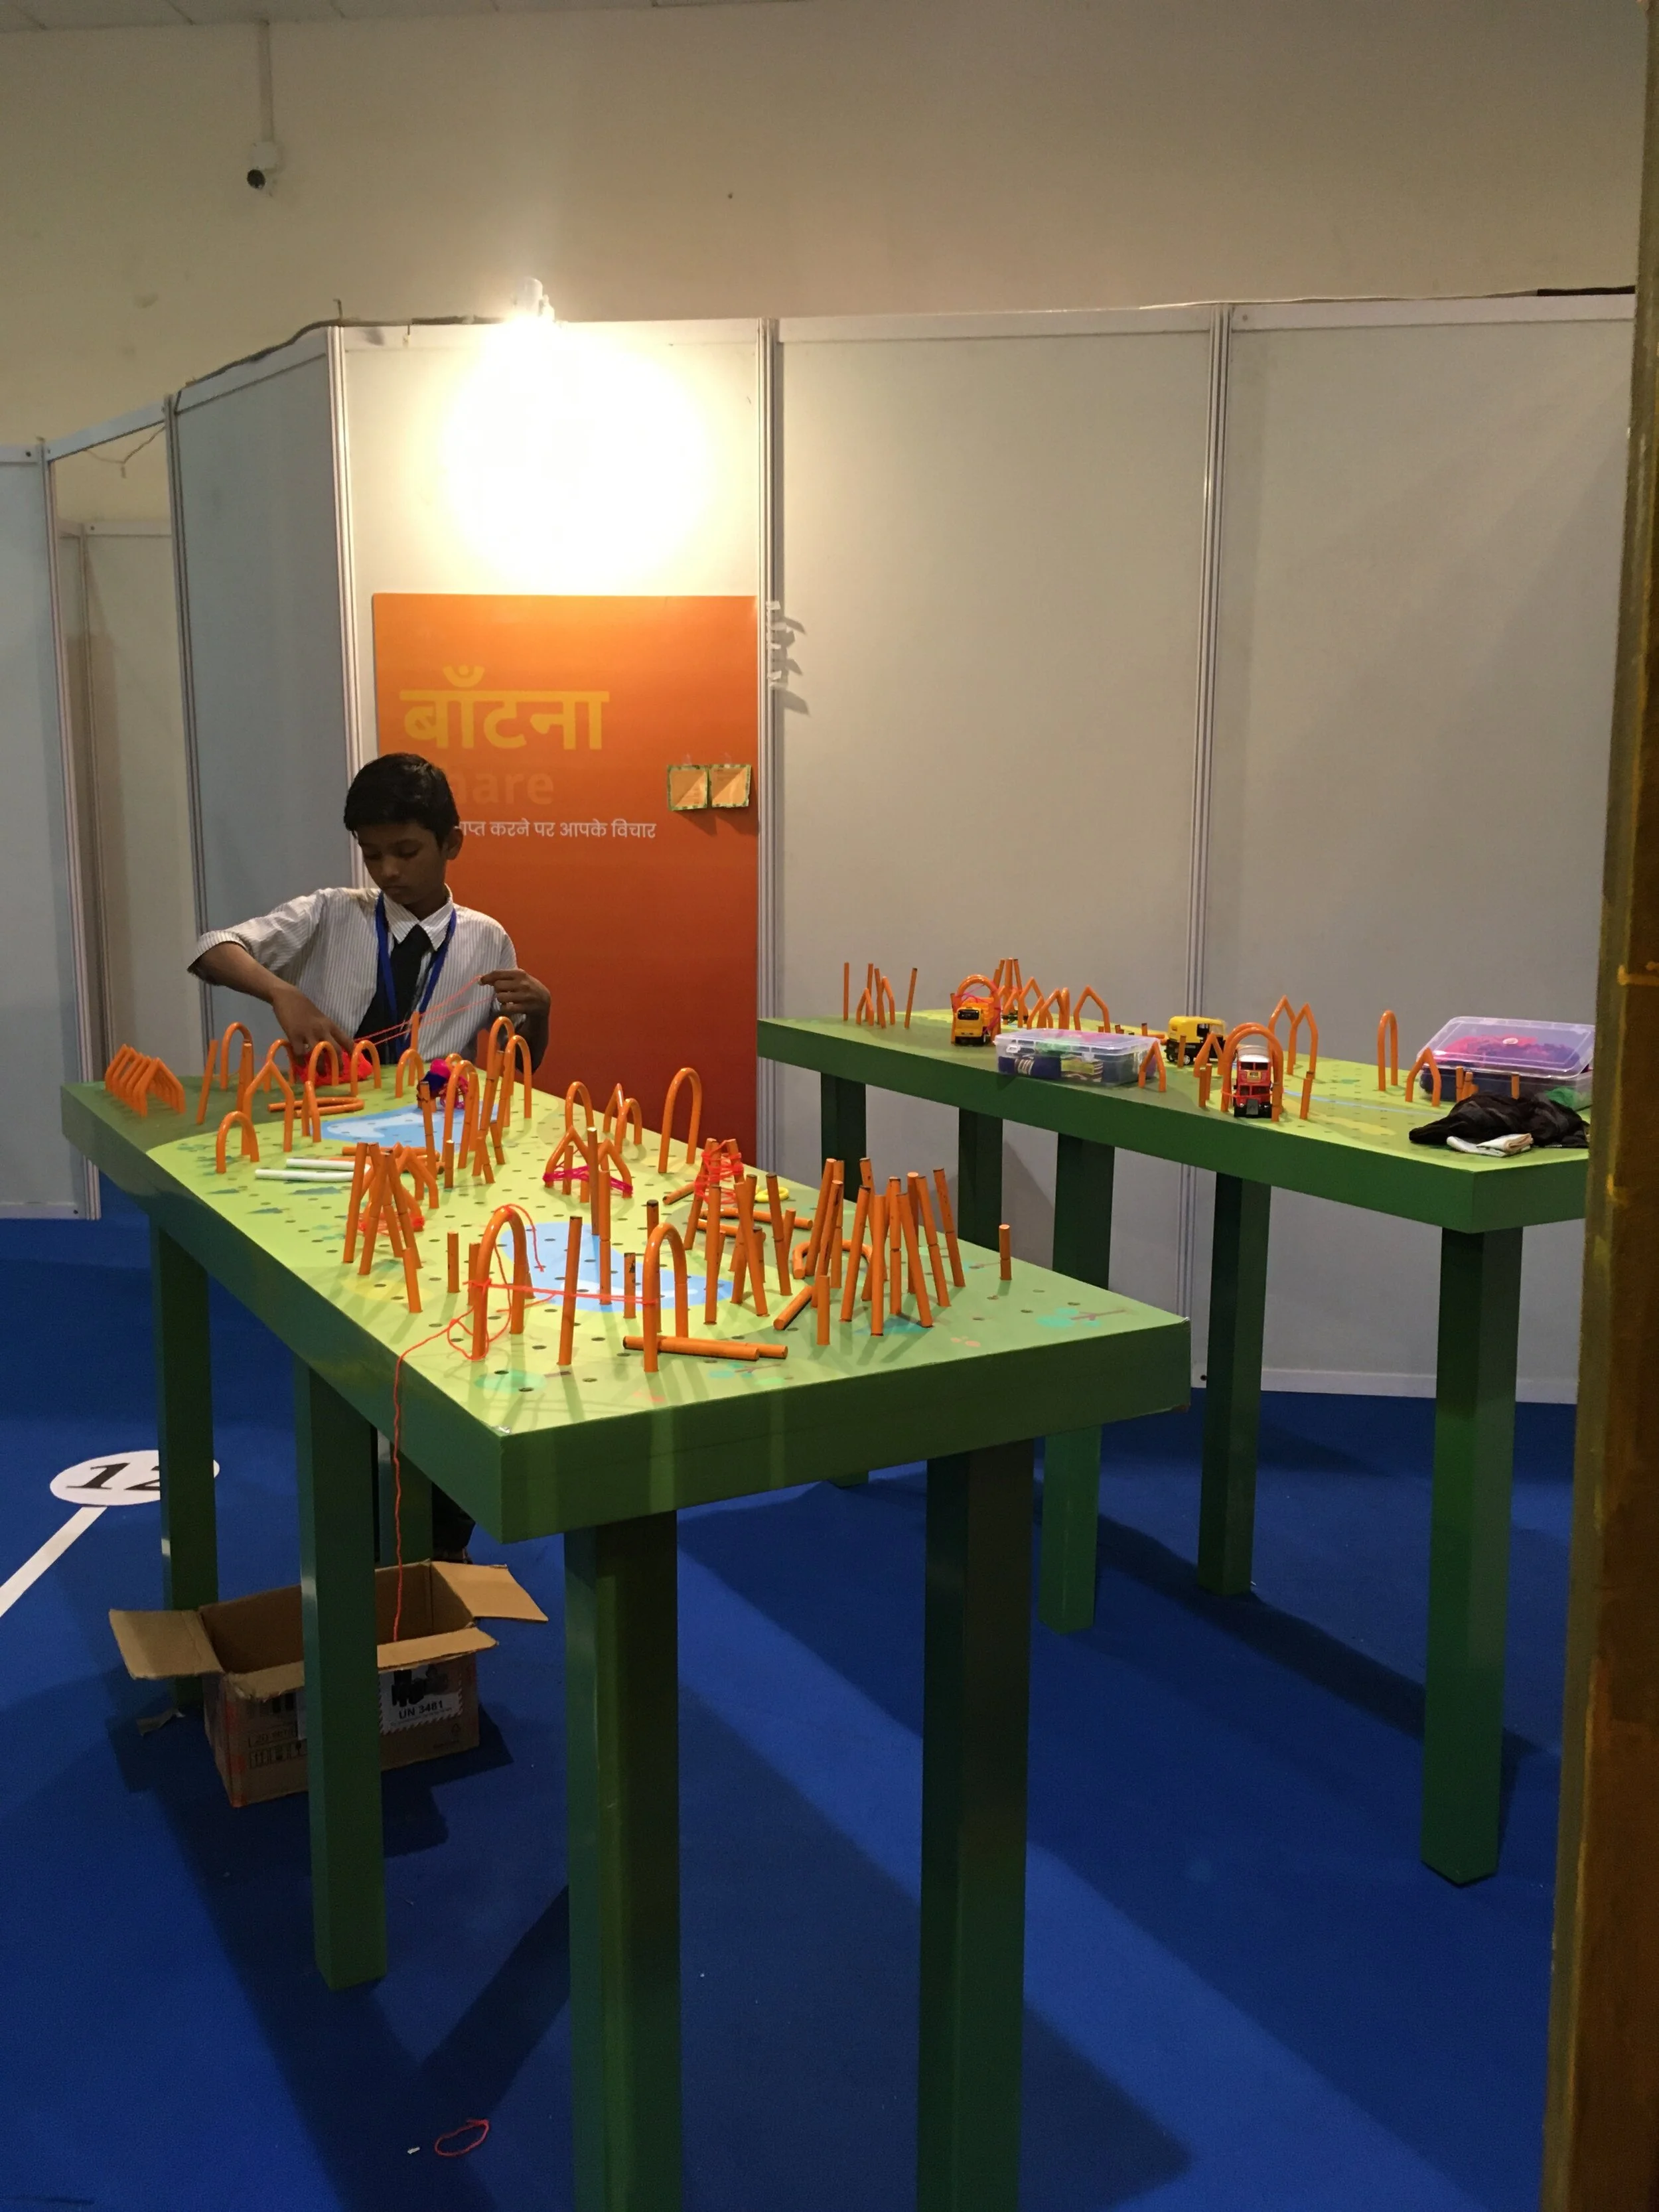
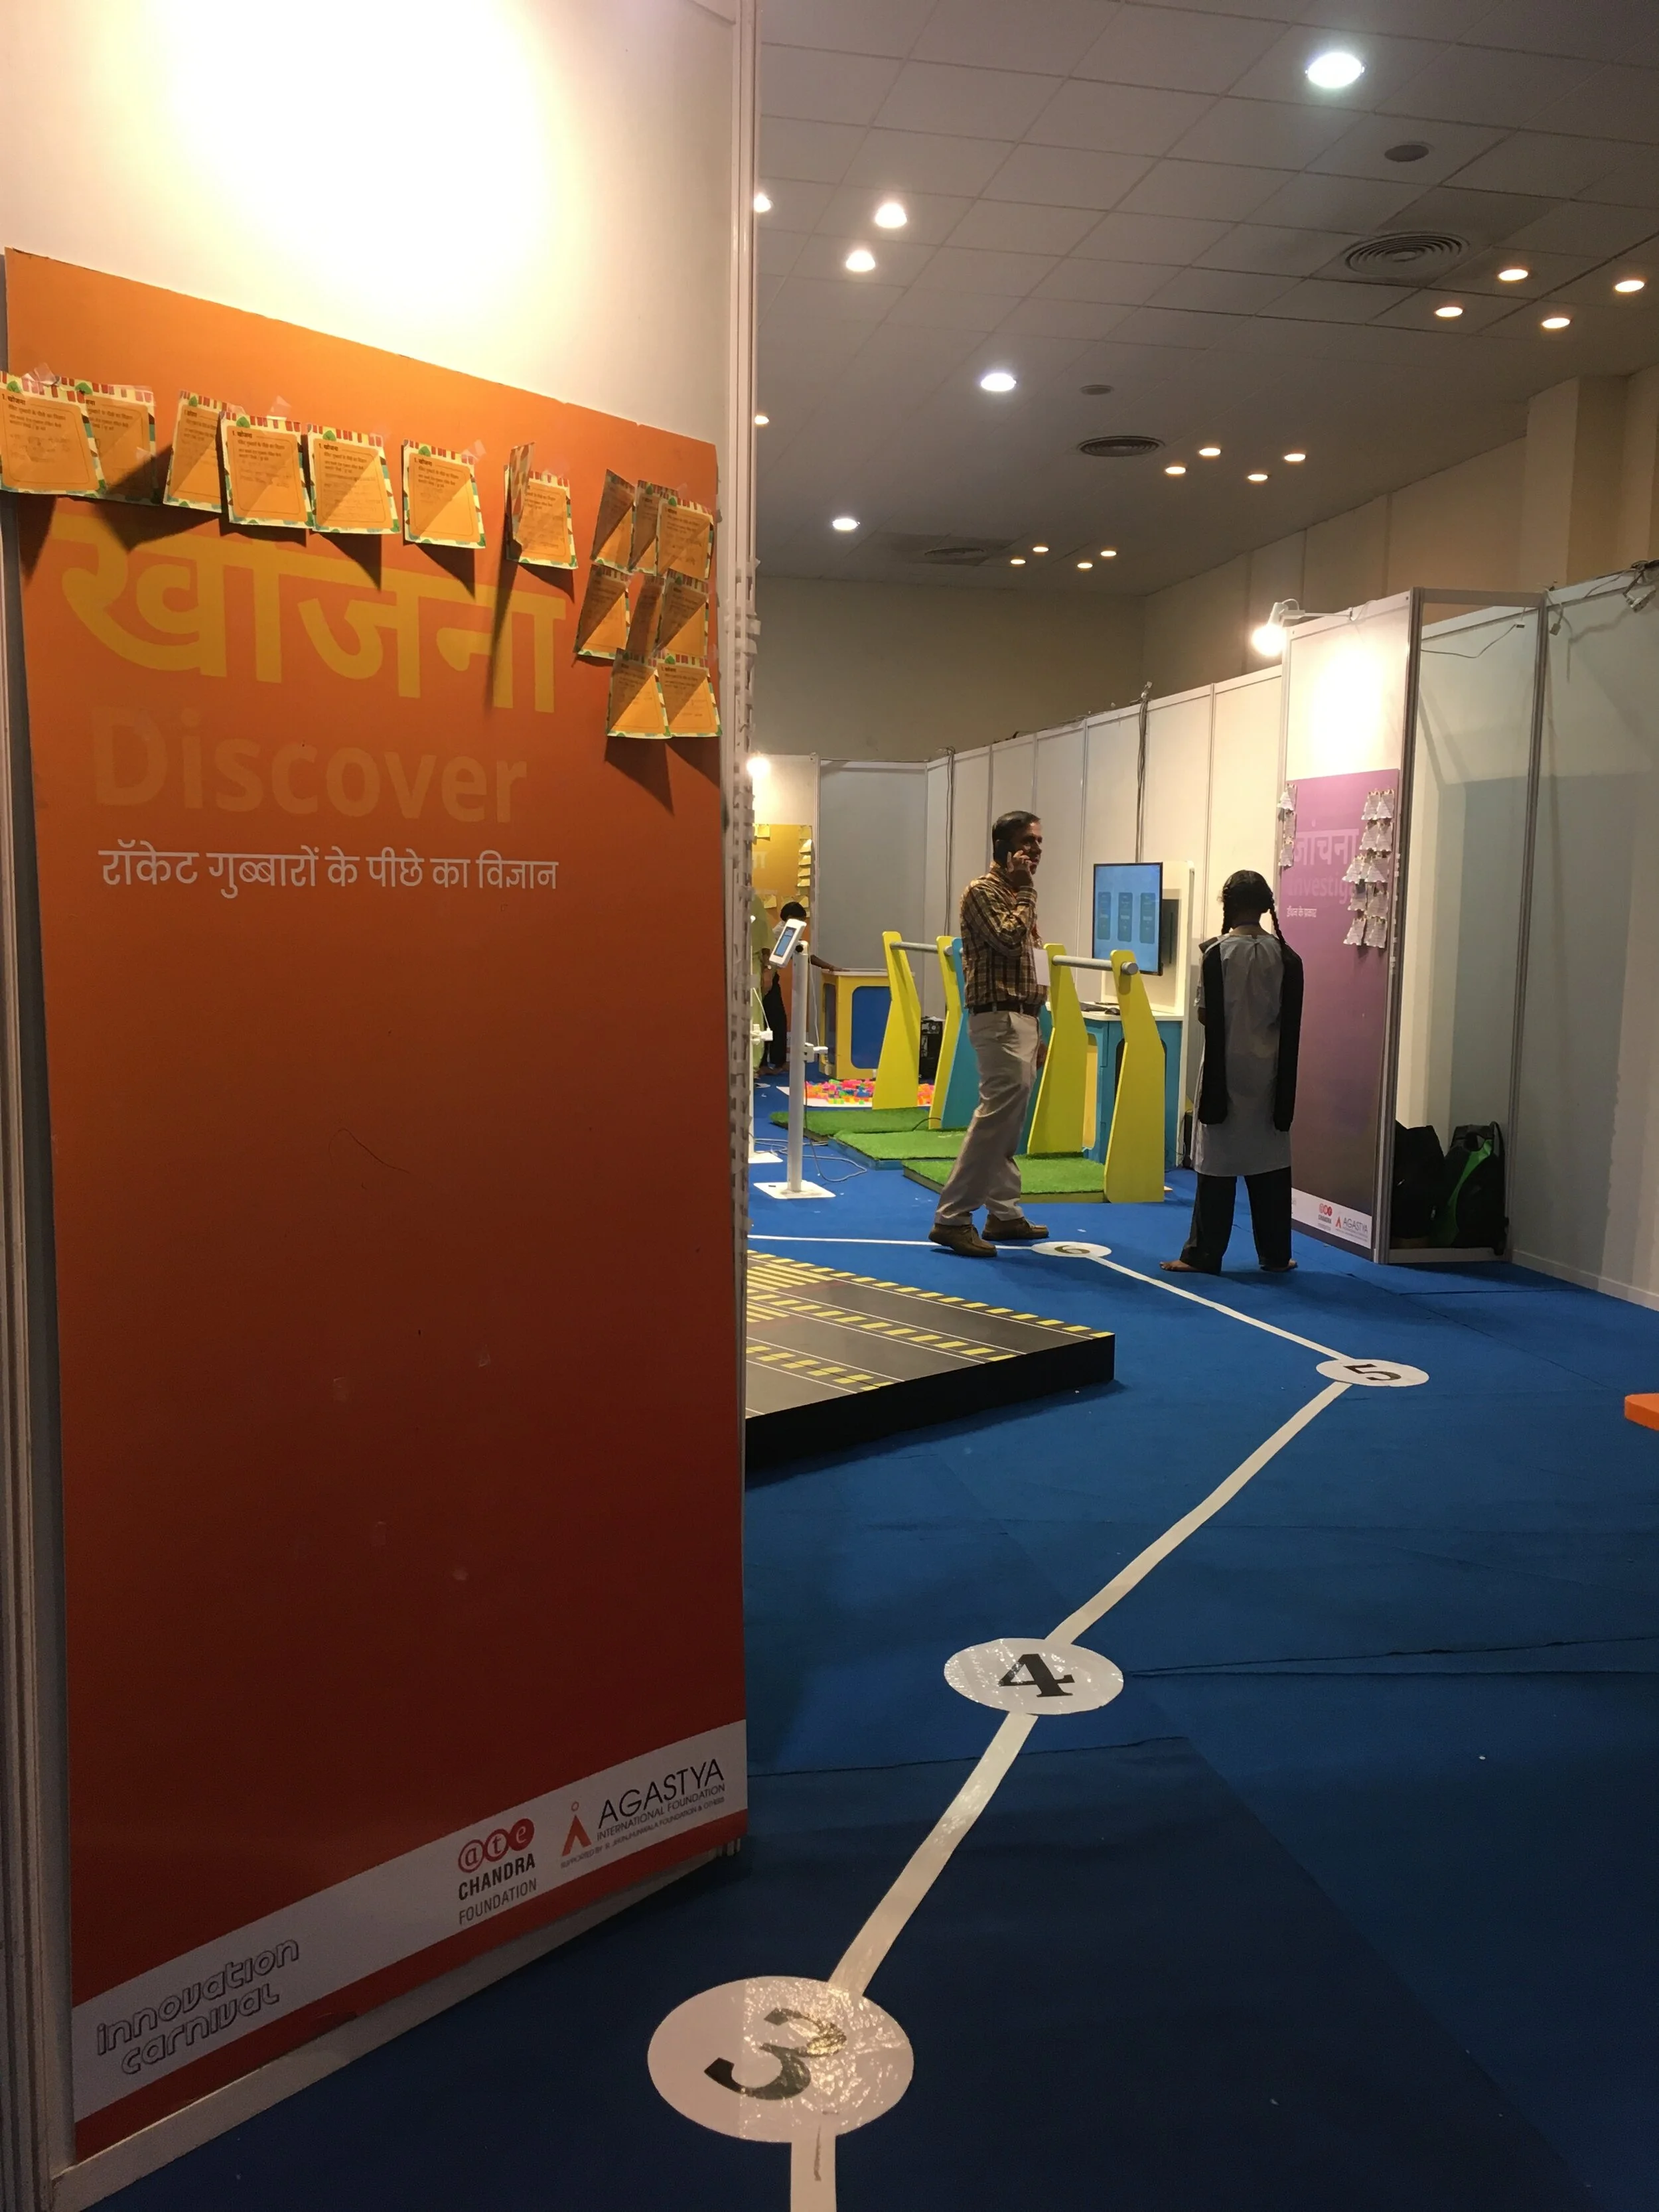
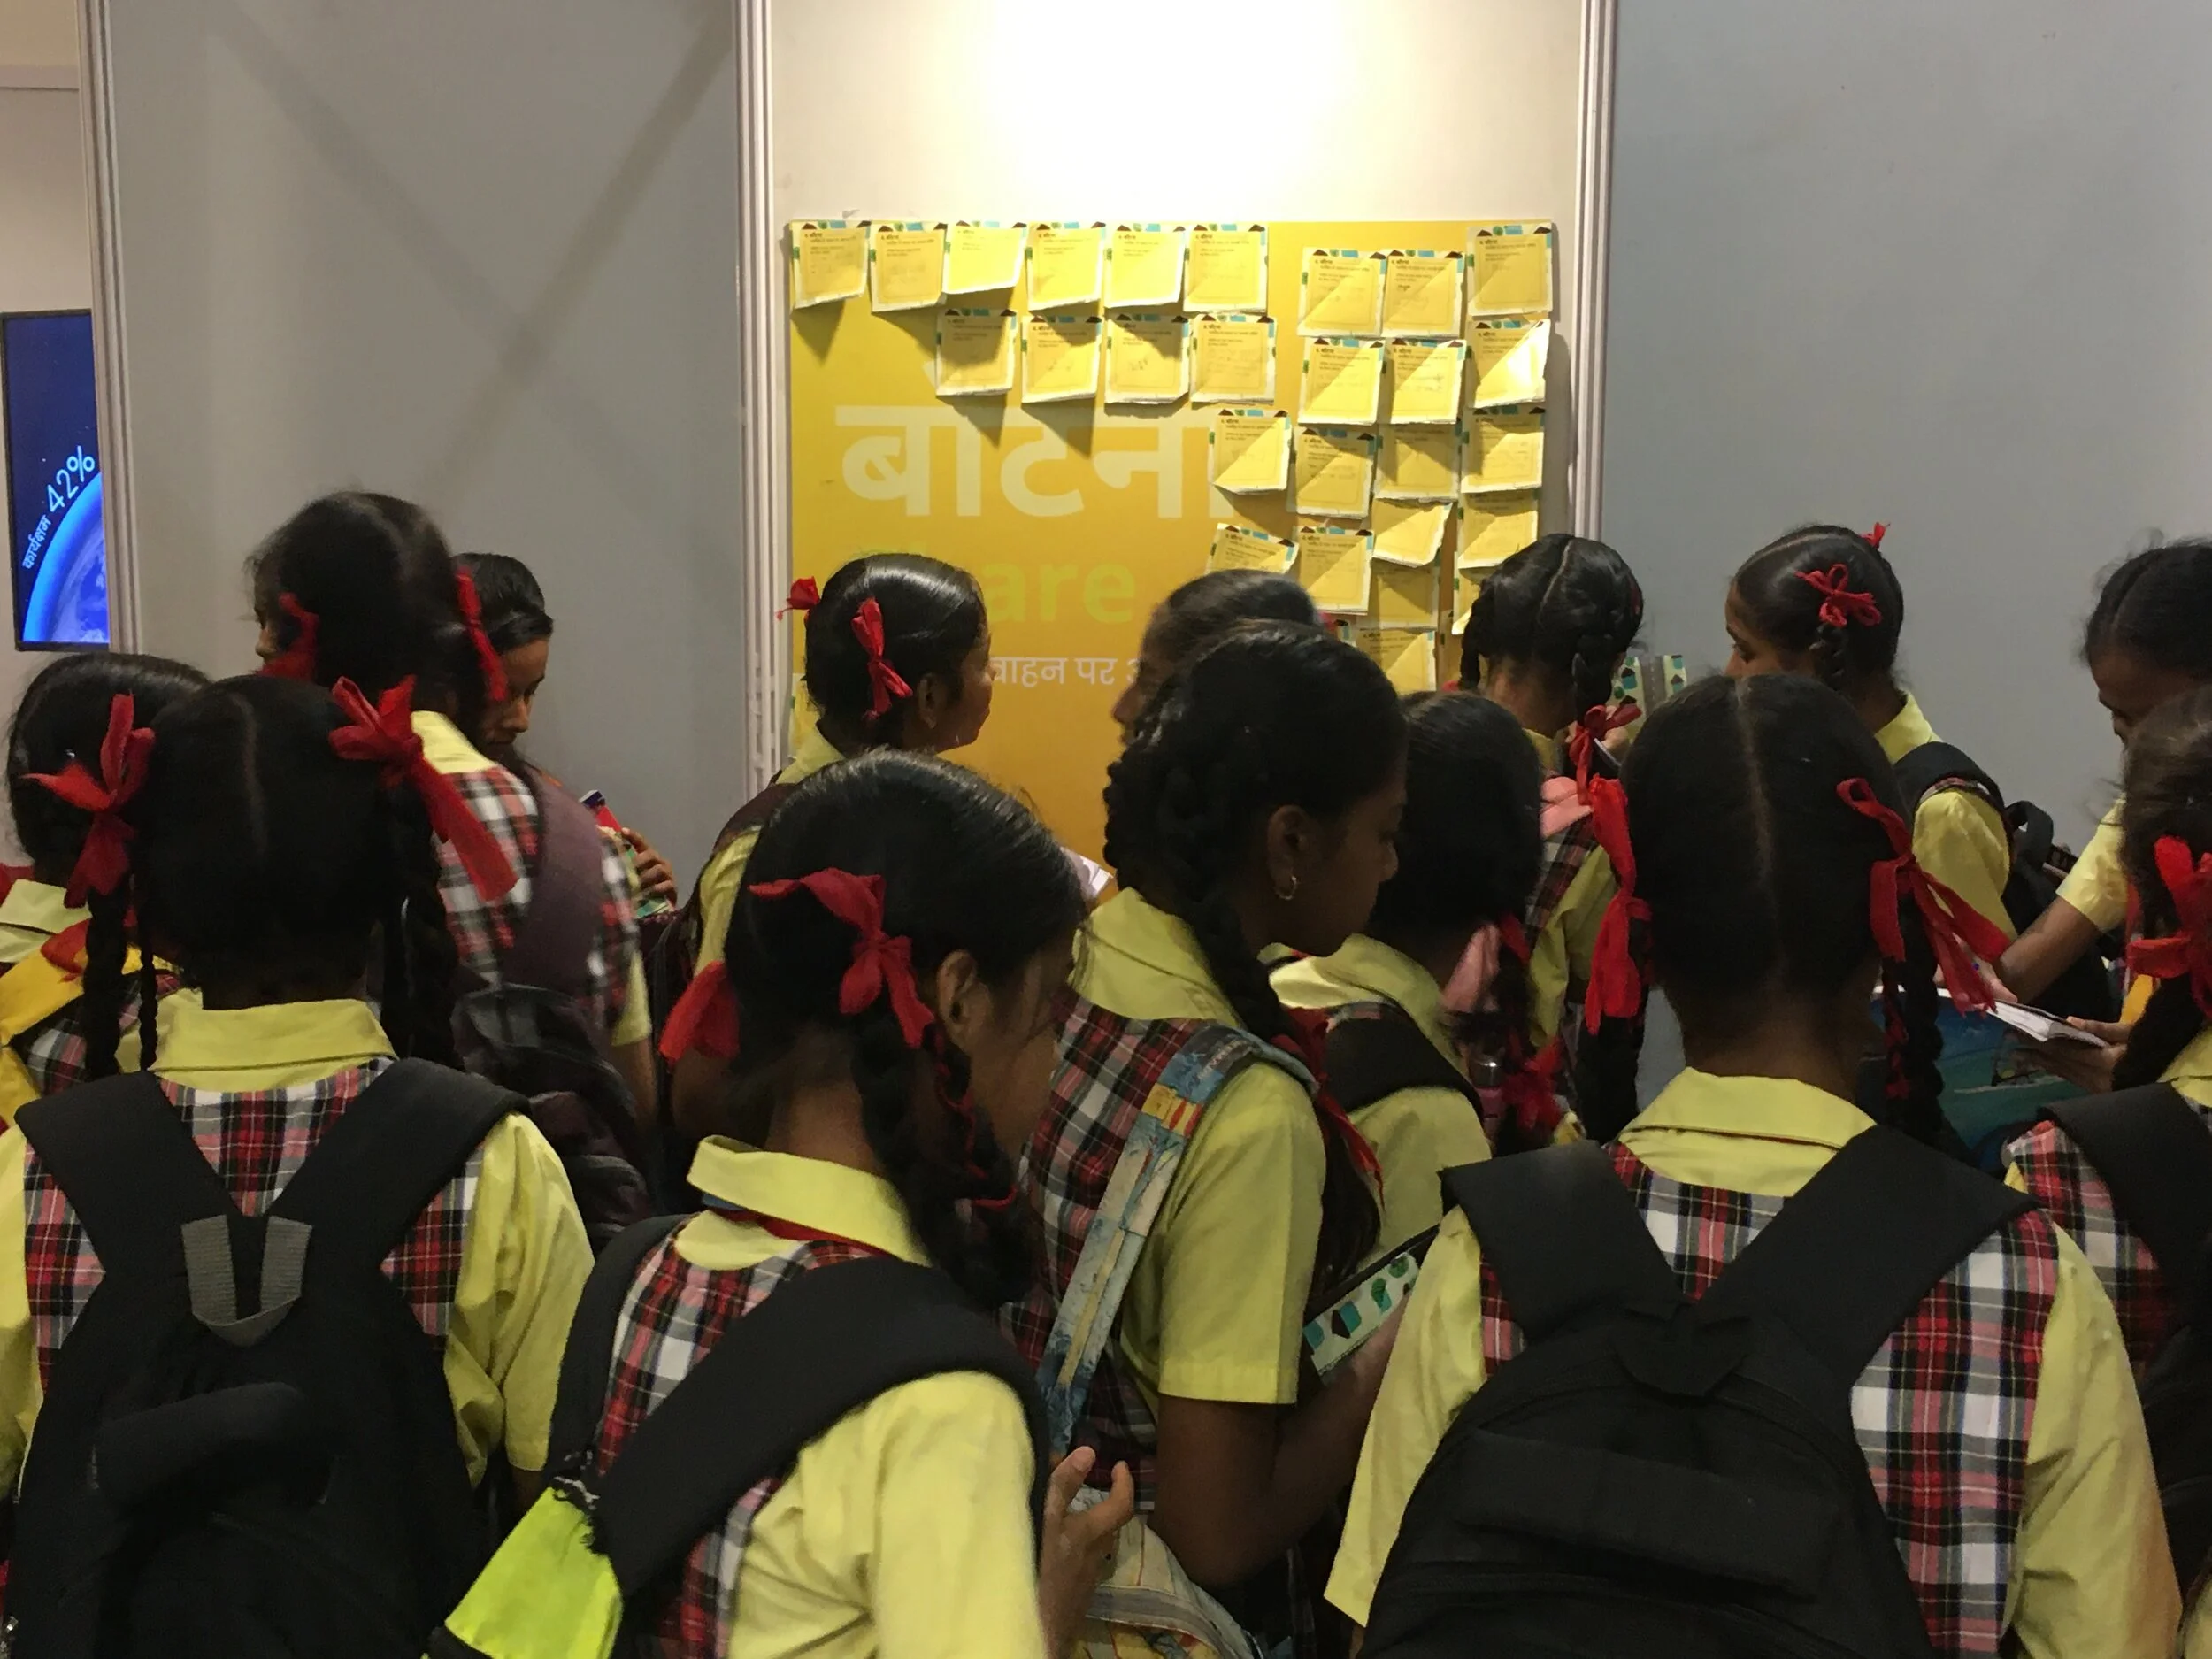
The Innovation Carnival is a four-day long exhibition run by Agastya International Foundation in Mumbai, Maharashtra. The Carnival consists of digital interactive installation displays and workshops for children based on the theme of sustainability and innovation. This is mainly open to children from Government schools in and around Mumbai. The first edition of the Carnival saw a staggering number of 3000 children attend and interact with all the jumbo-sized exhibits. We had Rube Goldberg inspired irrigation walls, City building installations, Farming exhibits and Balloon rocket stands to name a few. We wanted to impart important concepts to children through fun experiences, especially staying away from conventional methods like verbose posters and standees. However, the big question that came up, after observing children interact with the fun exhibits
Is the fun element in these exhibits only solely serving the purpose of fun? Are children too busy playing with the installations that they aren’t really learning anything from them?
So, I wanted to look into ways to make learning more impactful and efficient during these interactions with gamified, fun experiences.
Reflections from the first edition of the Carnival
“We require children to explore and reflect upon the exhibits at the same time.
A possible addition to the entire exhibition is for us to provide them with a jot-down pamphlet/ worksheet which they carry with them and fill/ complete whatever is required of each exhibit. The worksheet can be fully graphical with the entire exhibition pathway laid out as a map. As they move through the exhibition and stop at each exhibit, they fill out that part of the workbook.
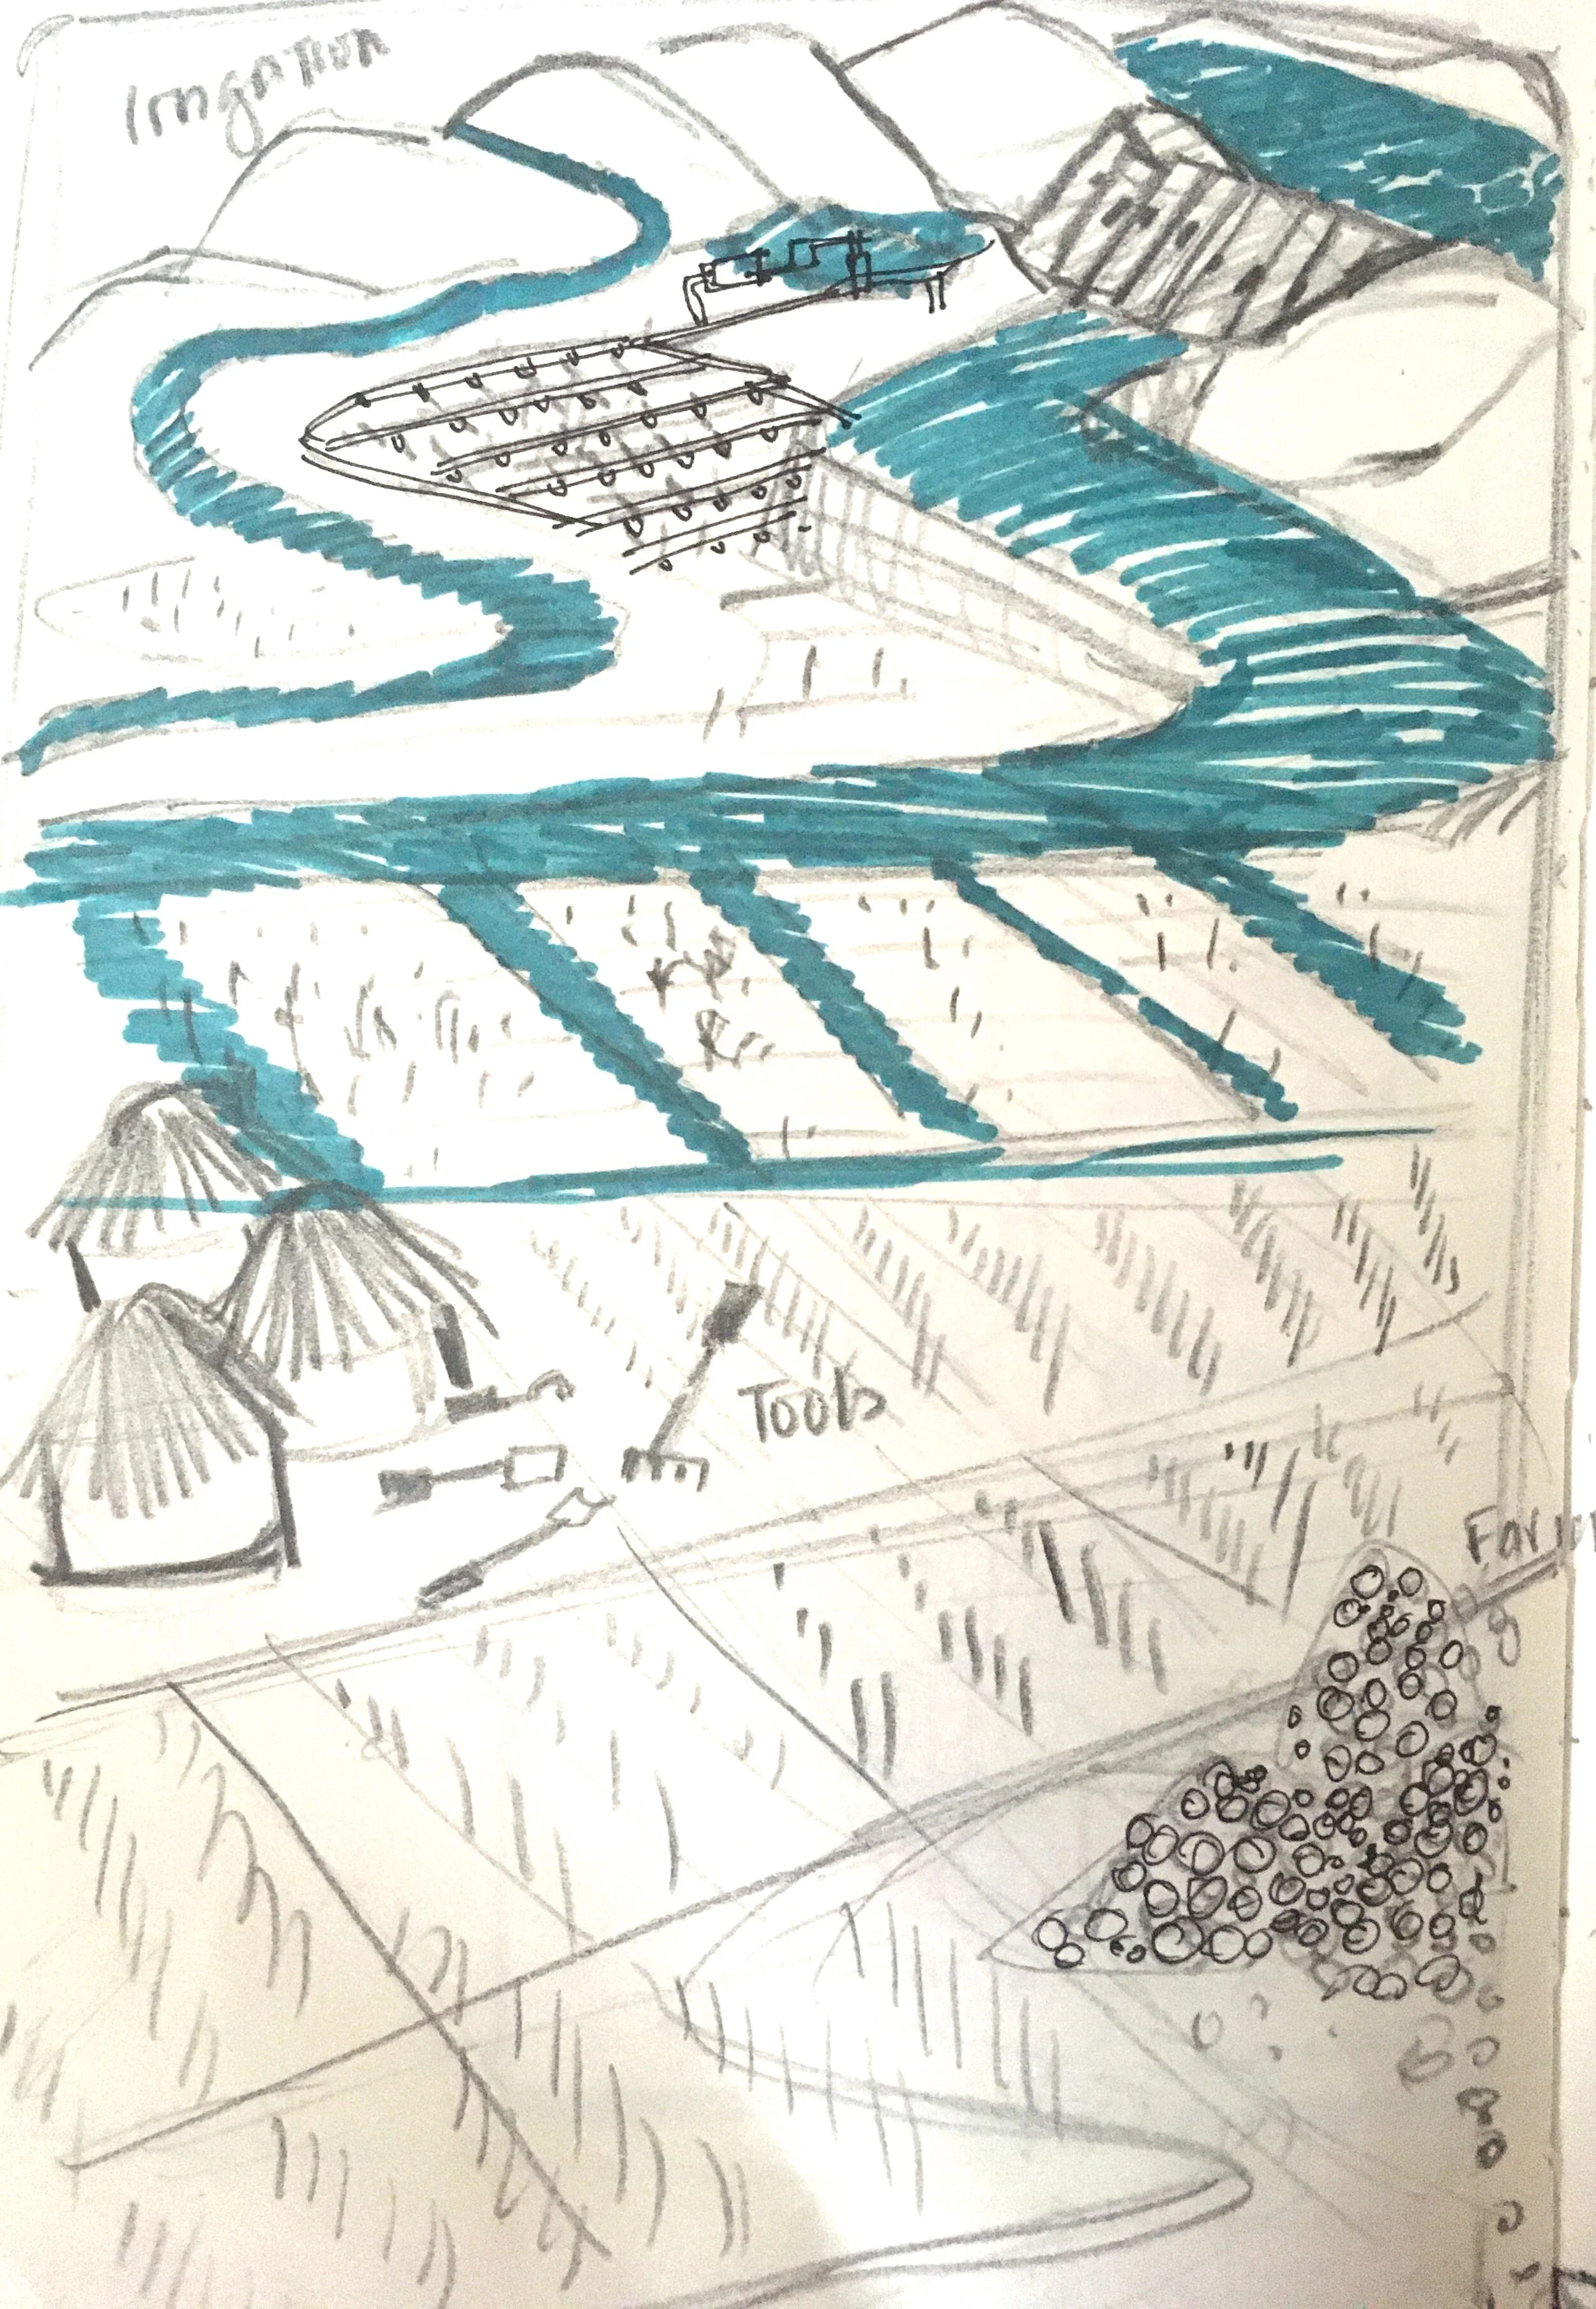
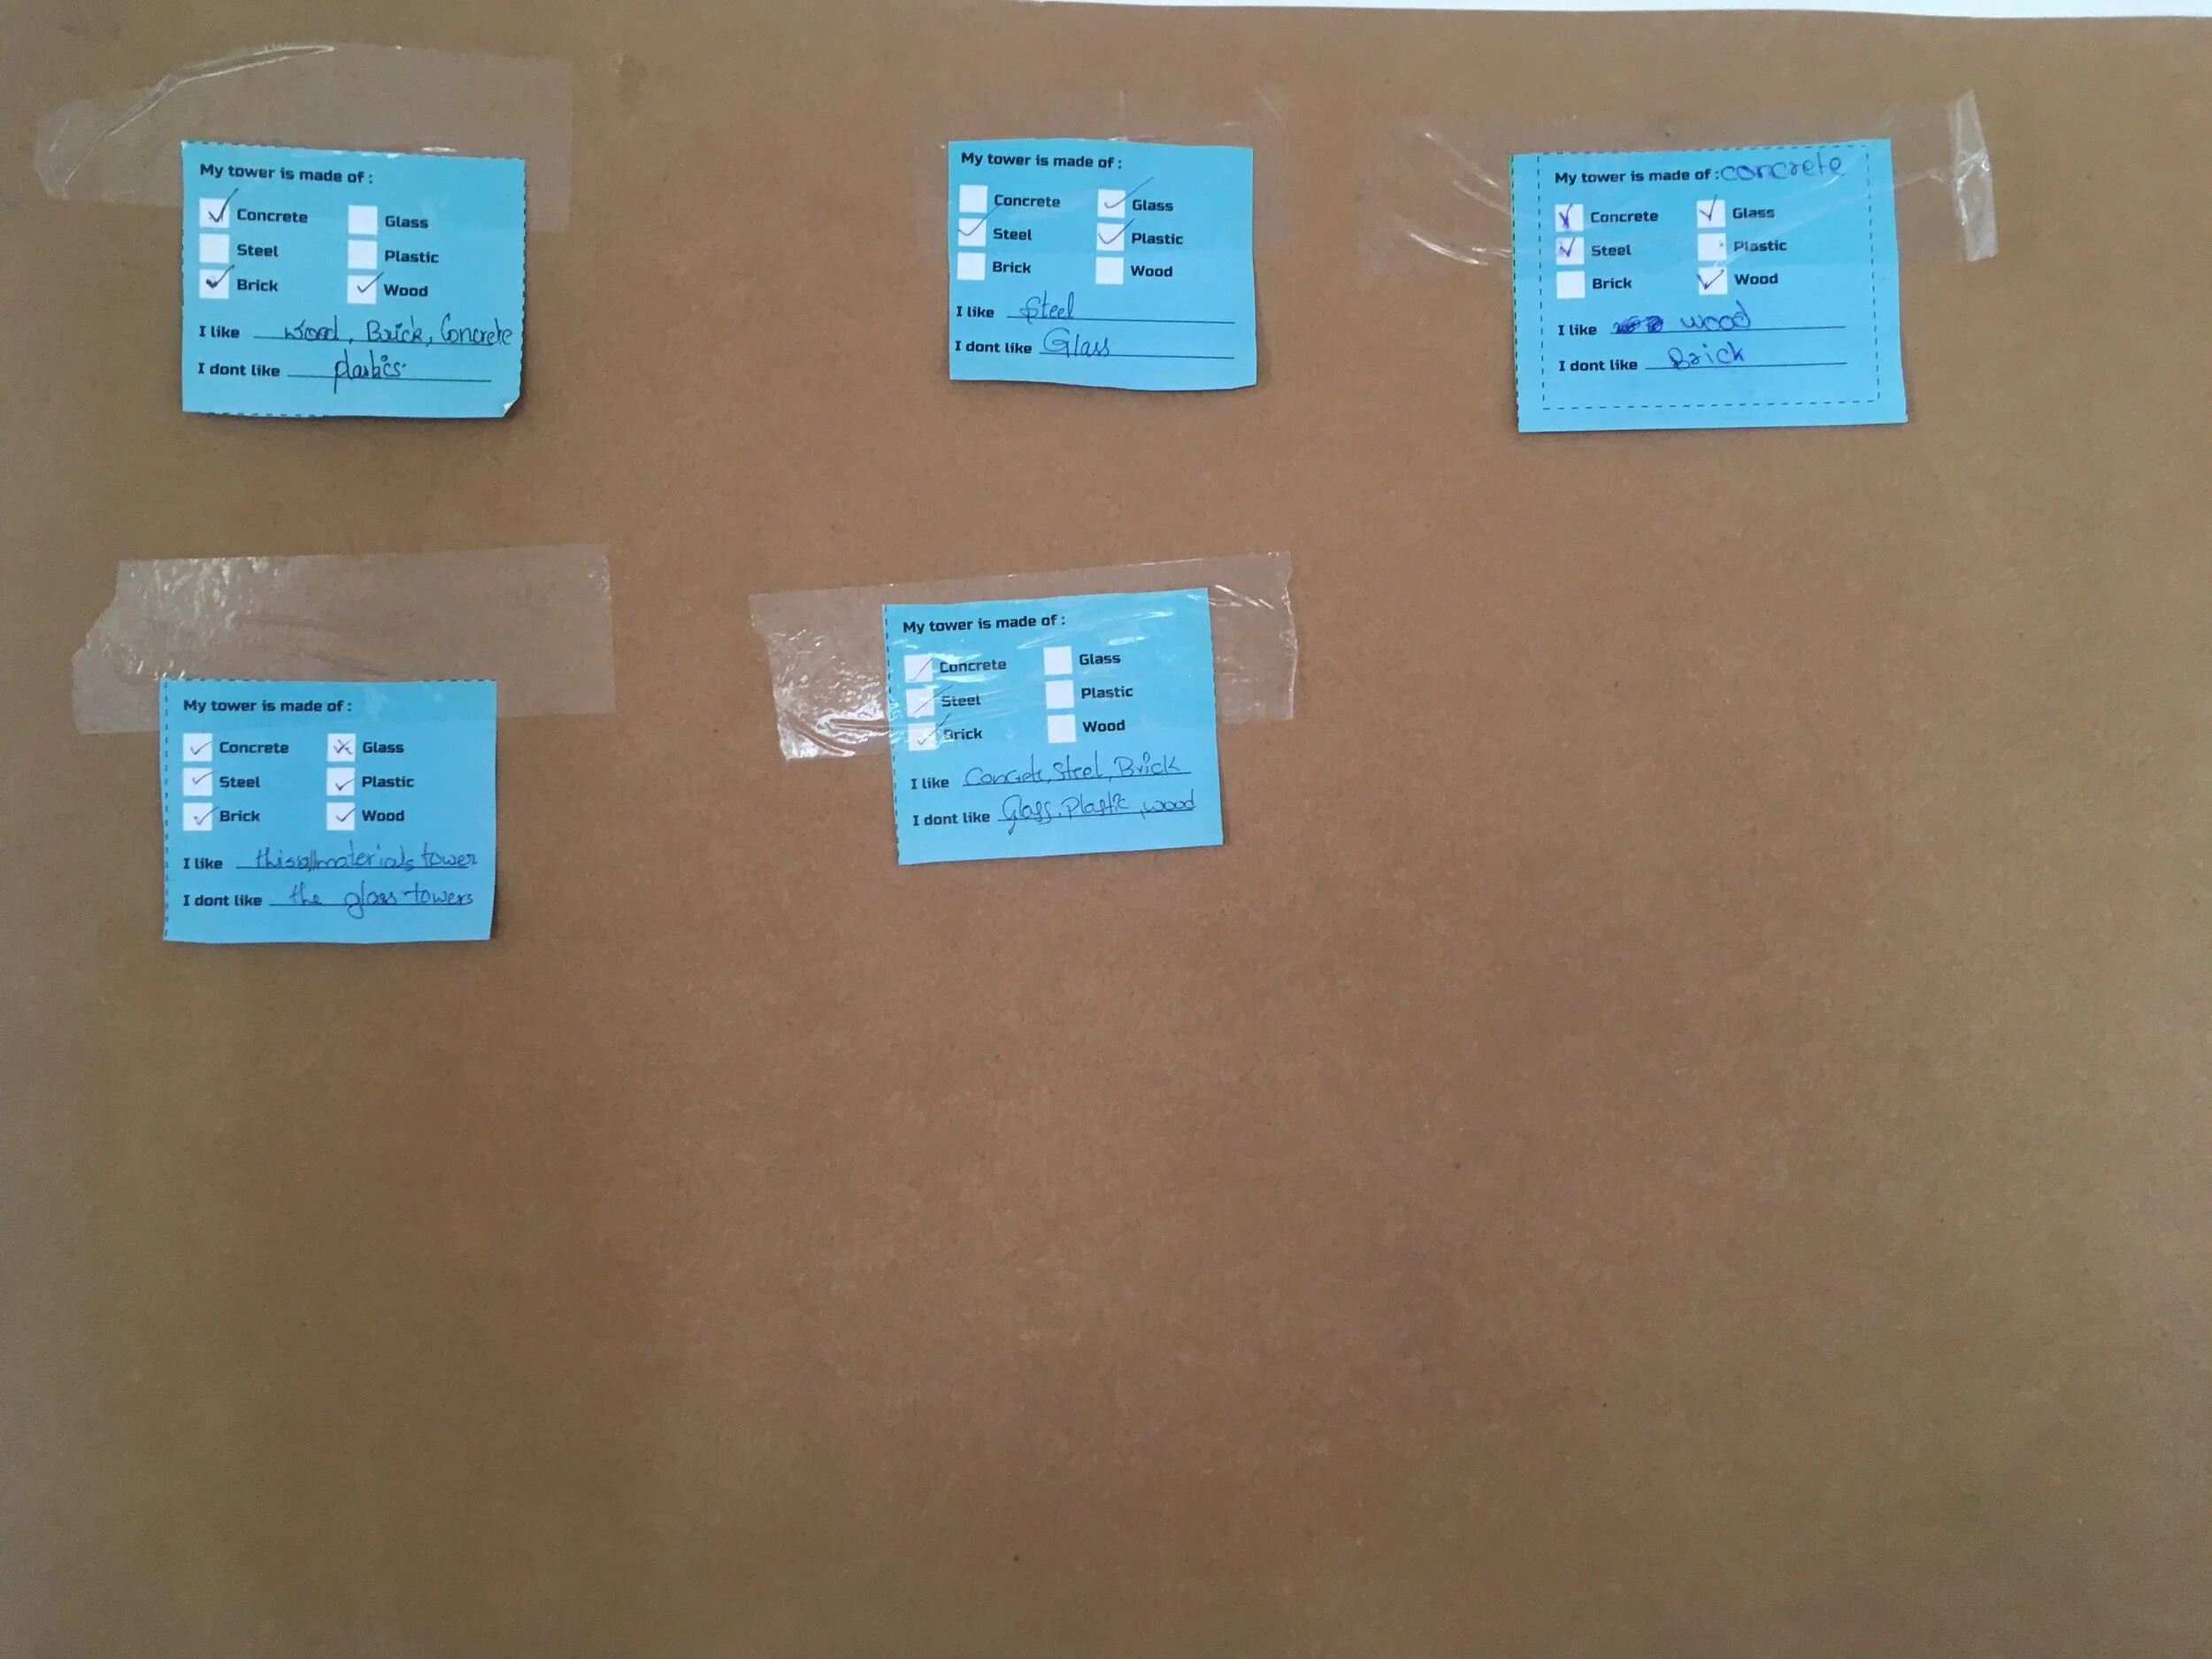
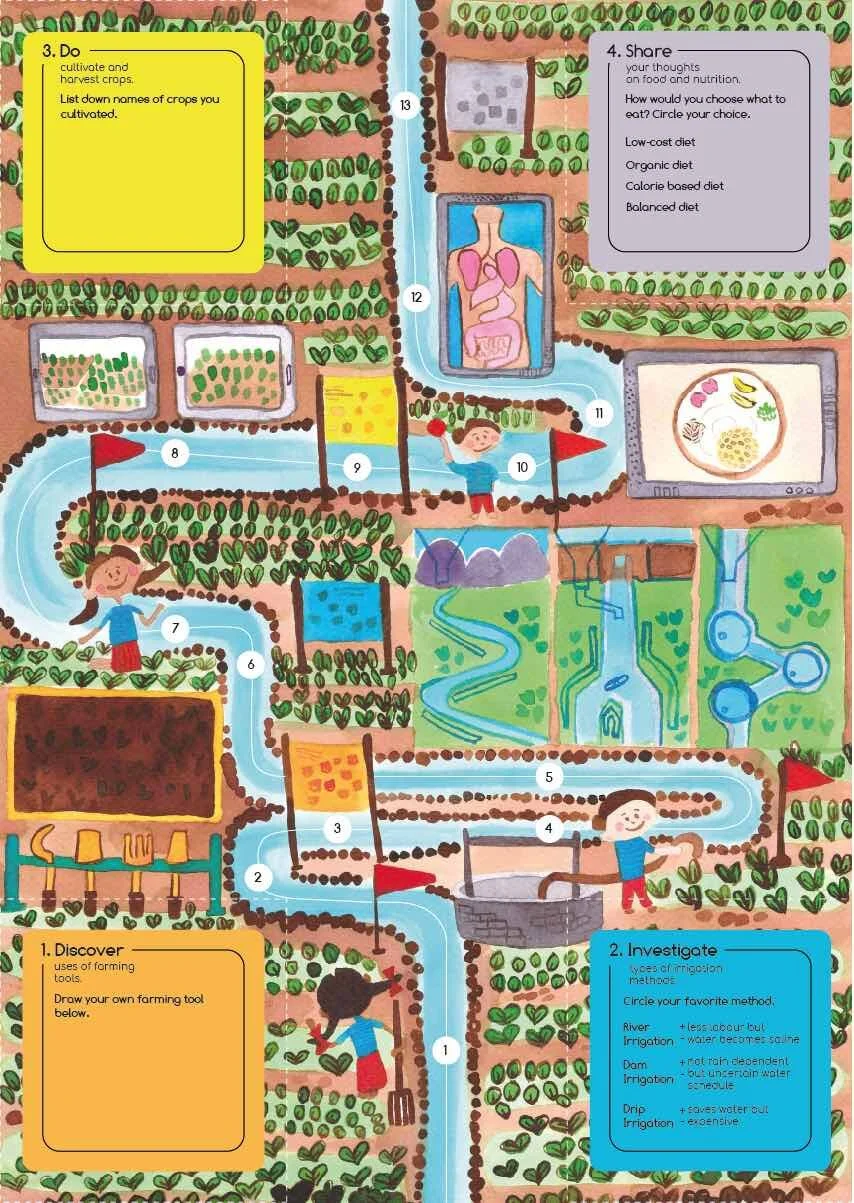
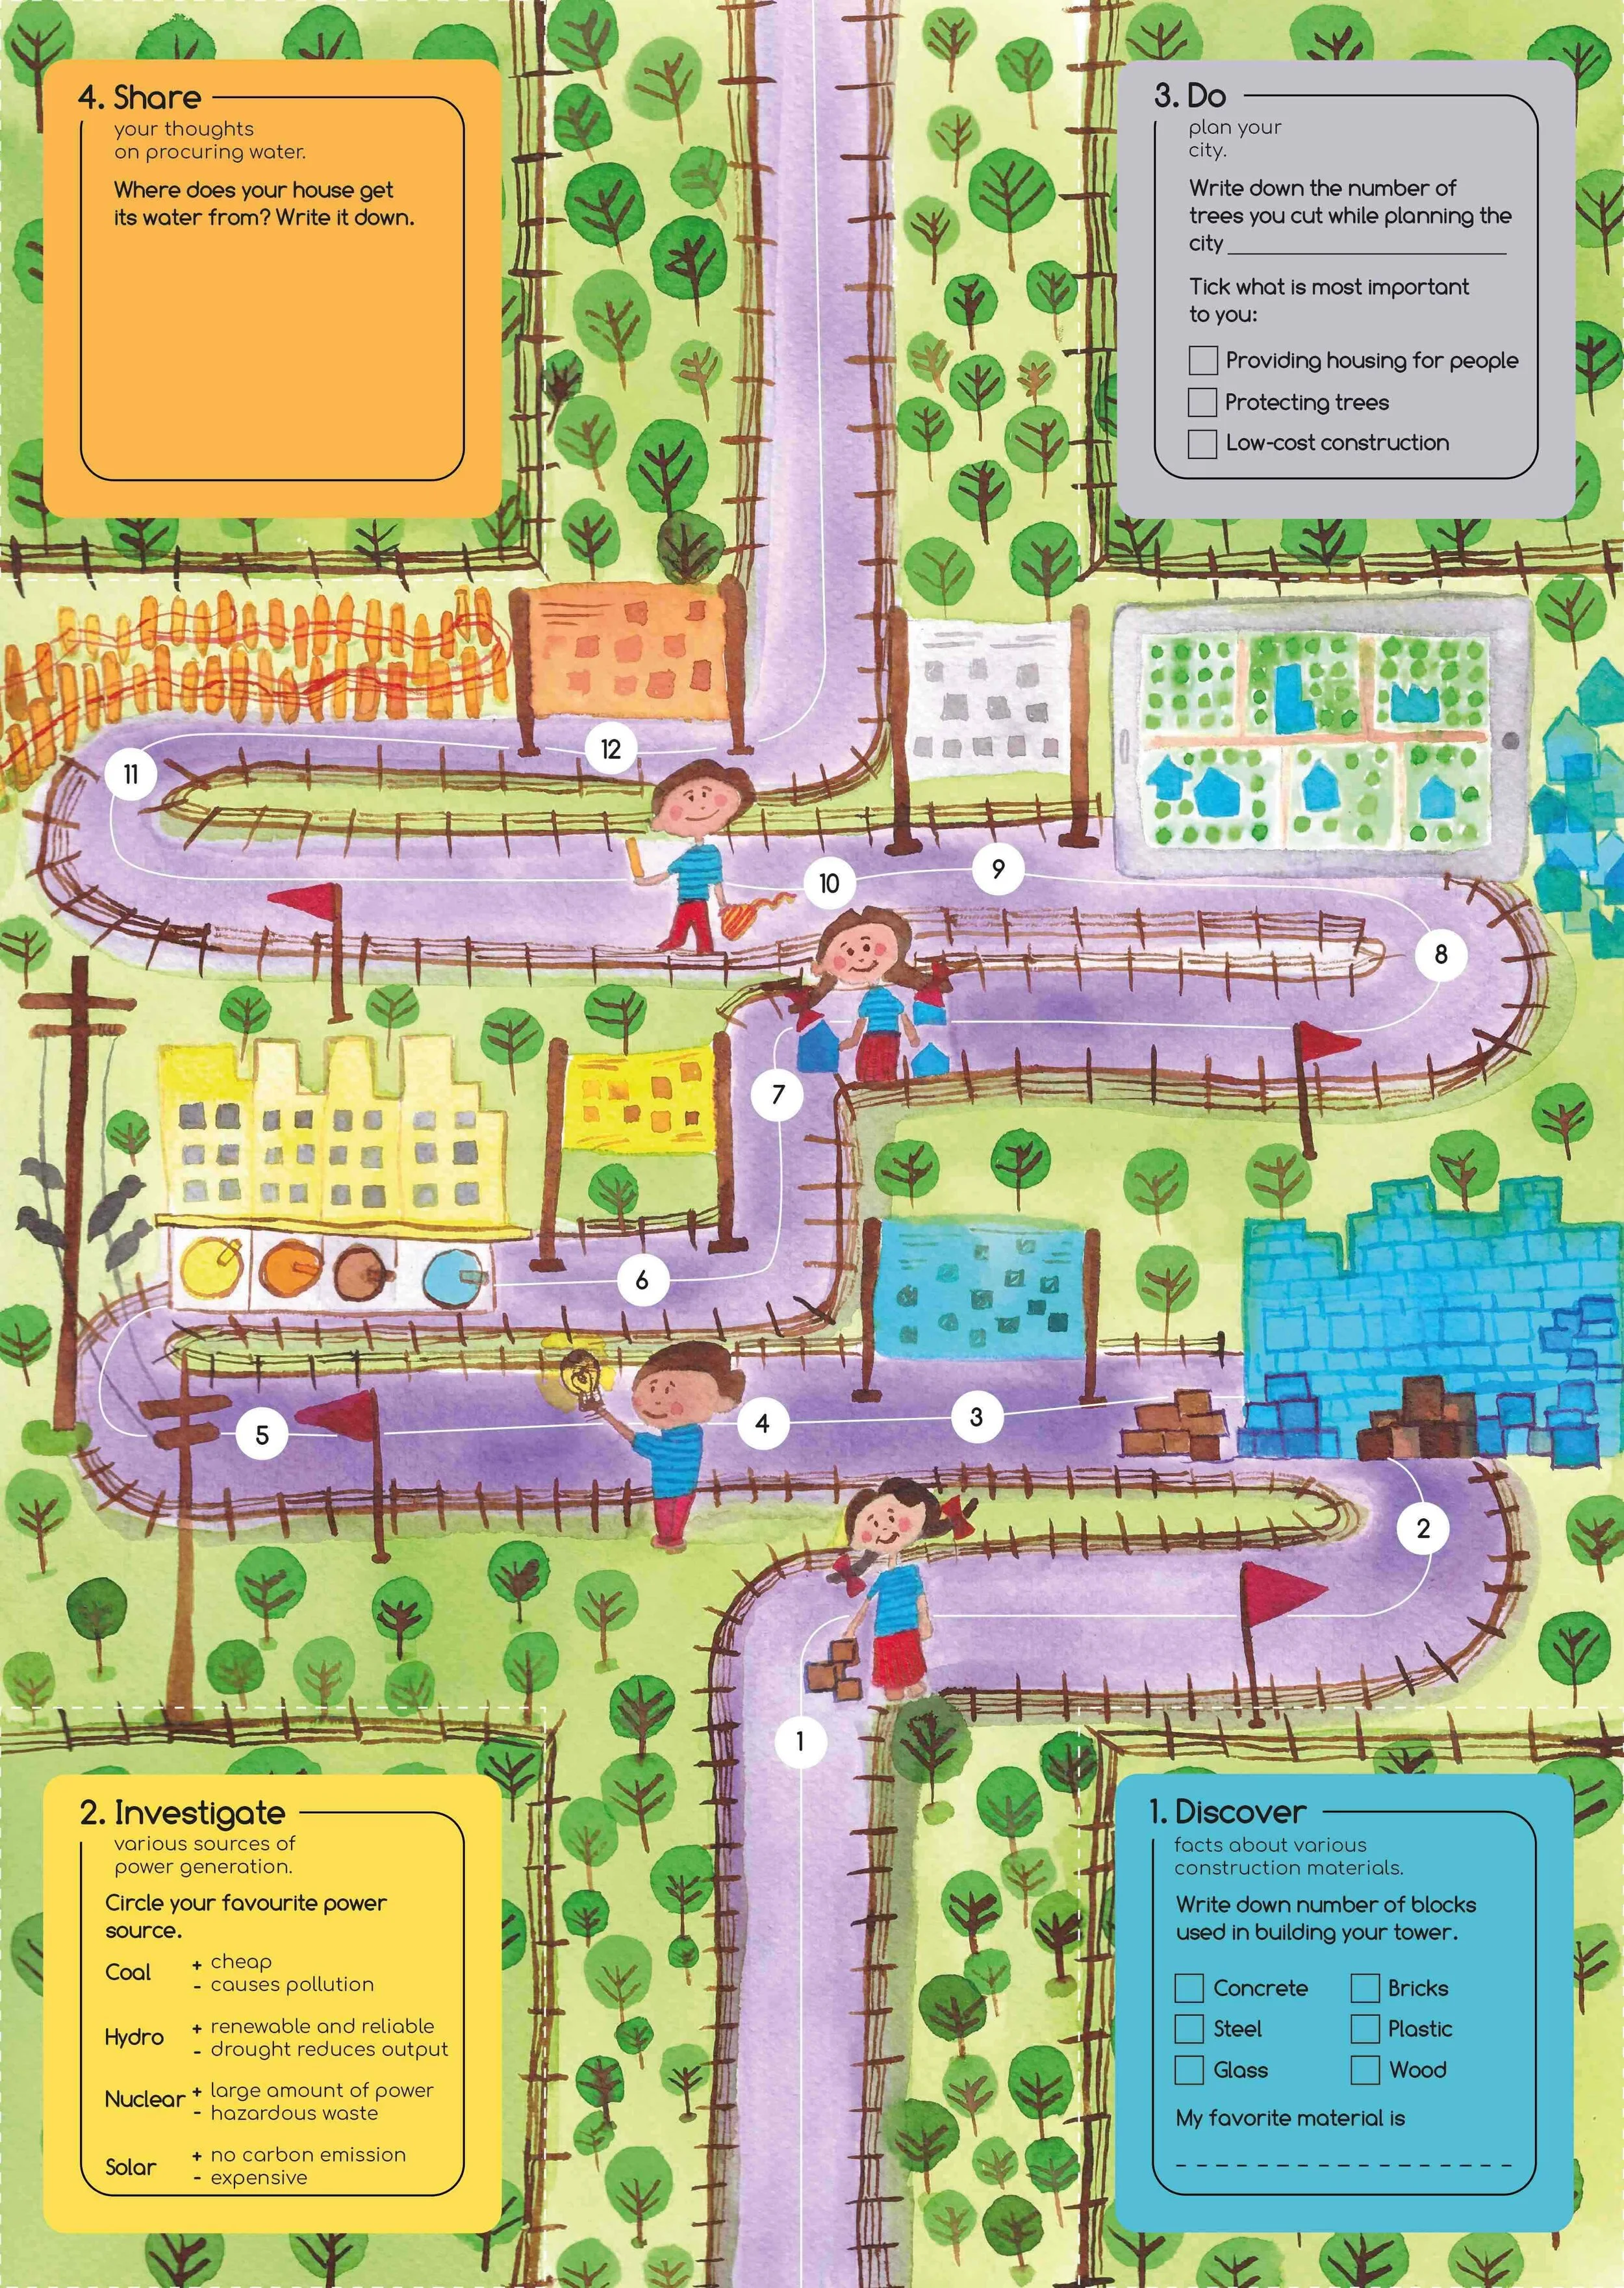
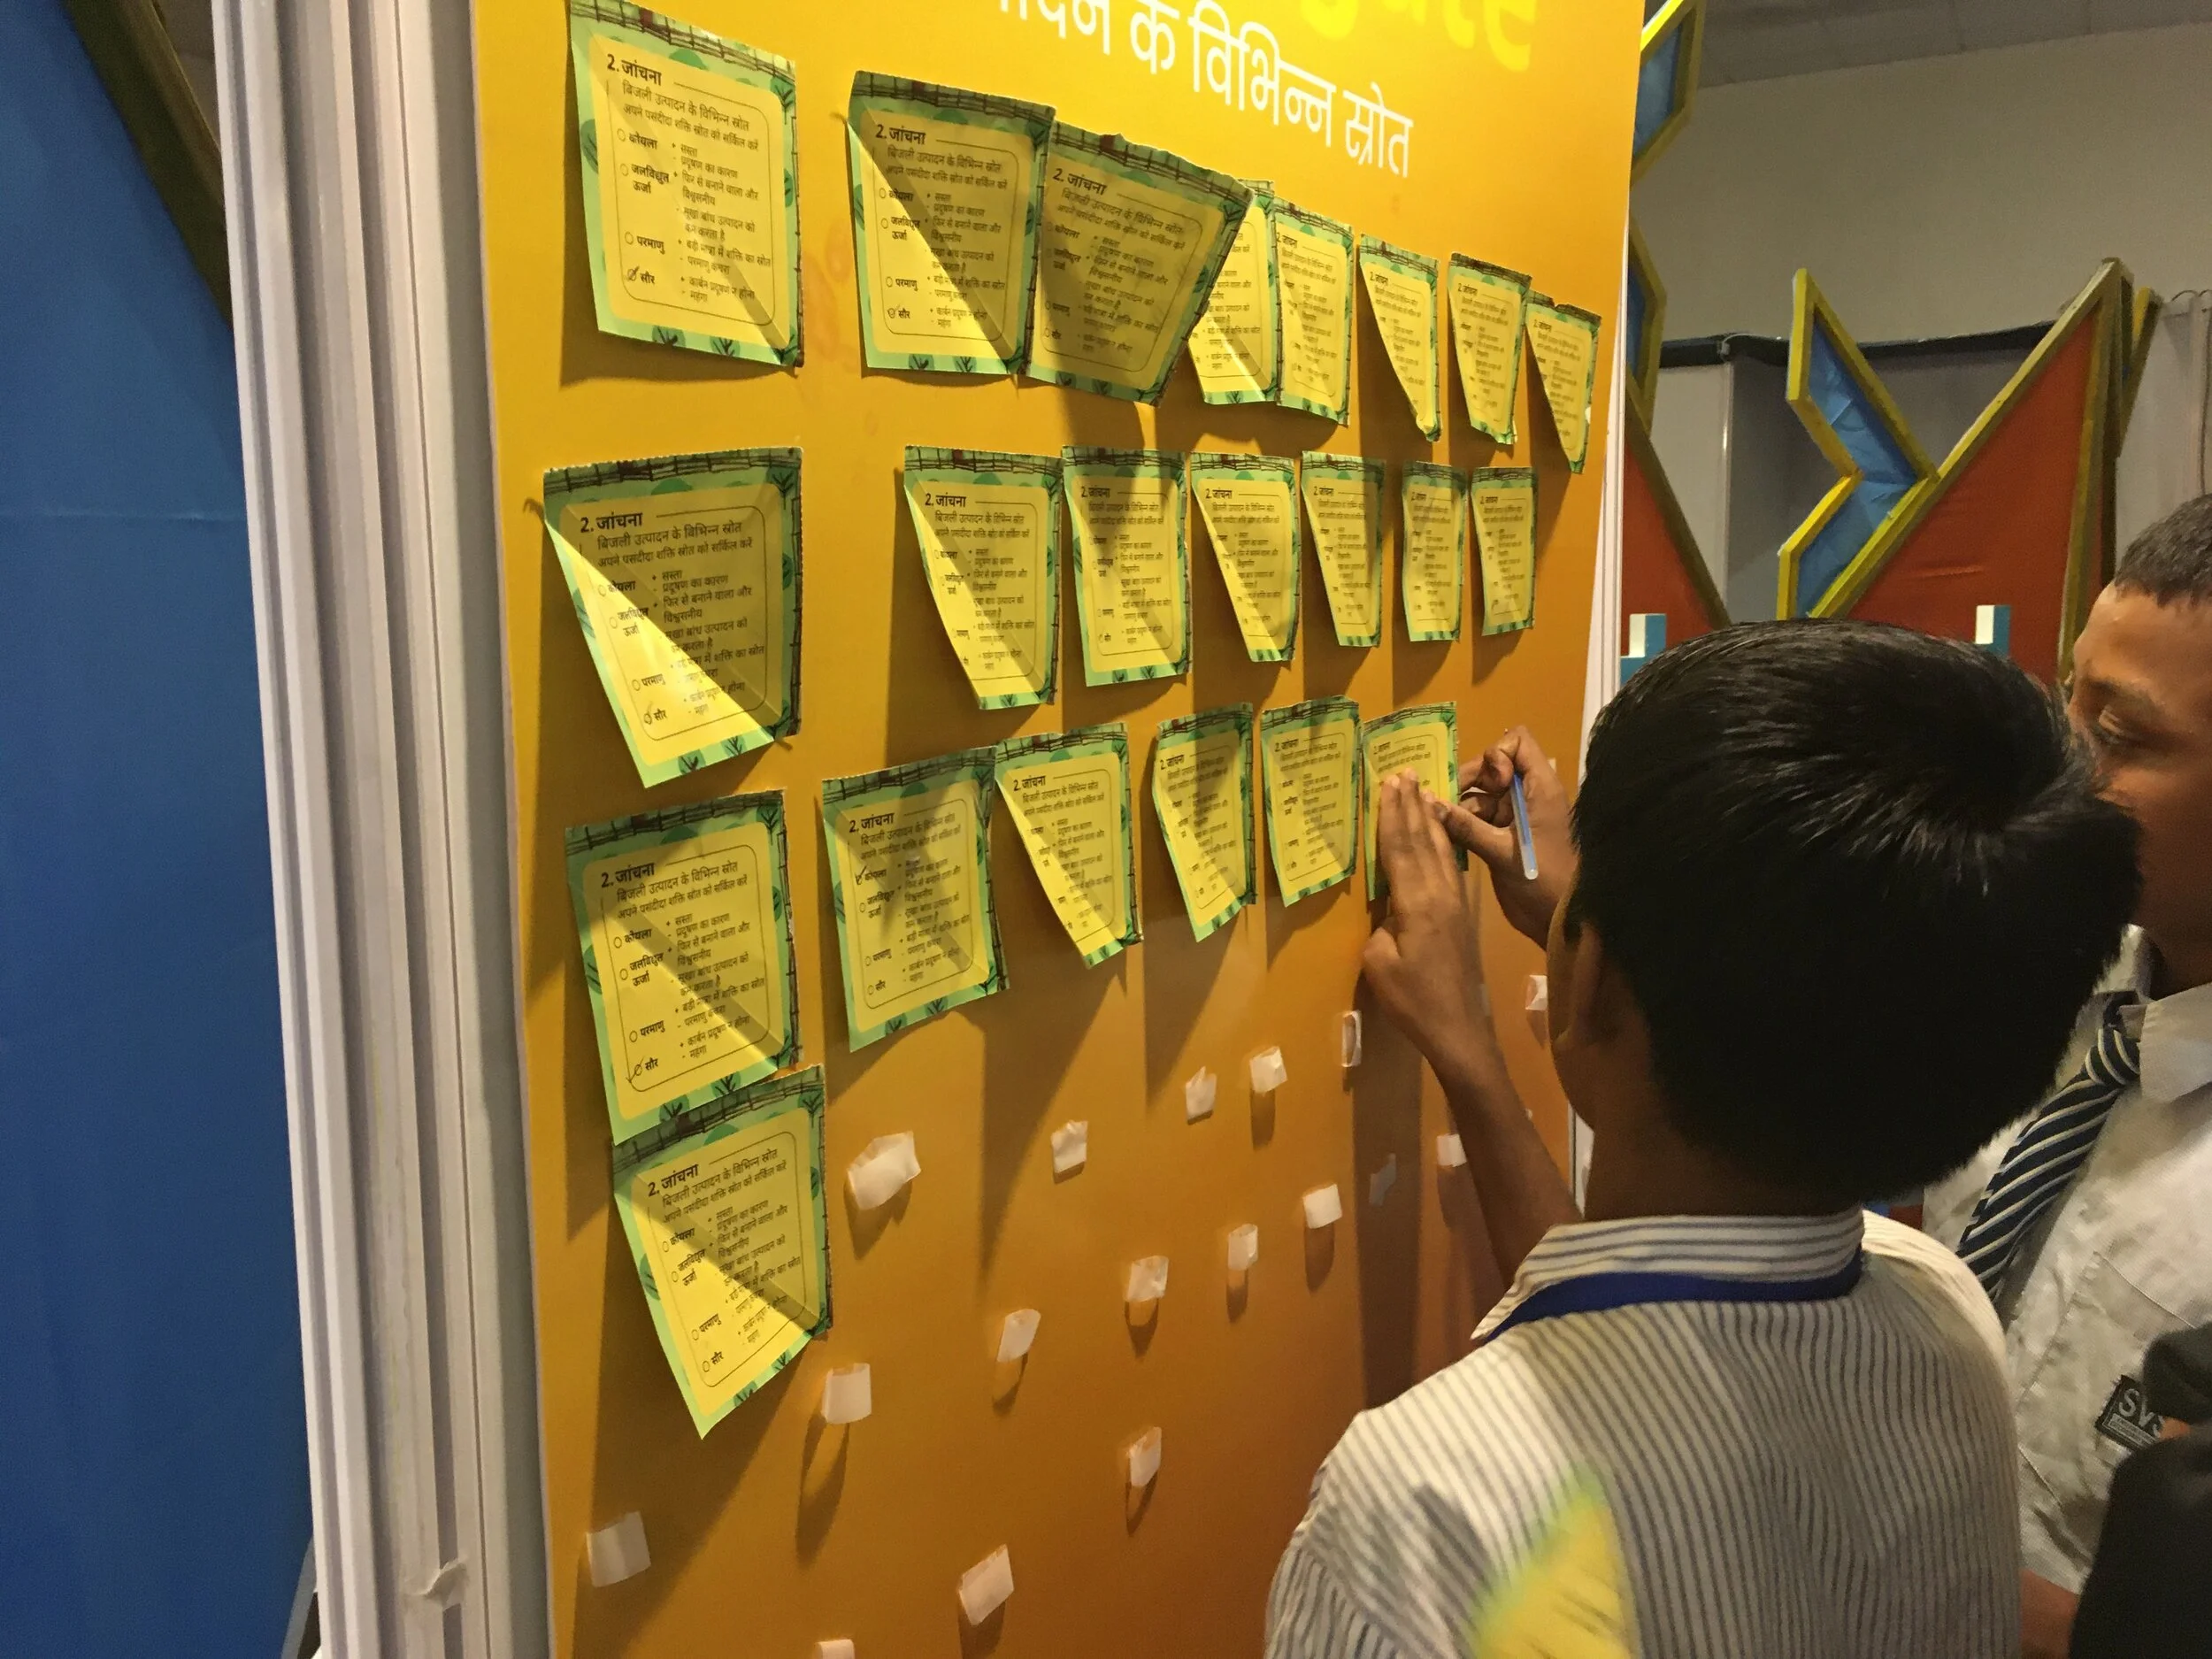
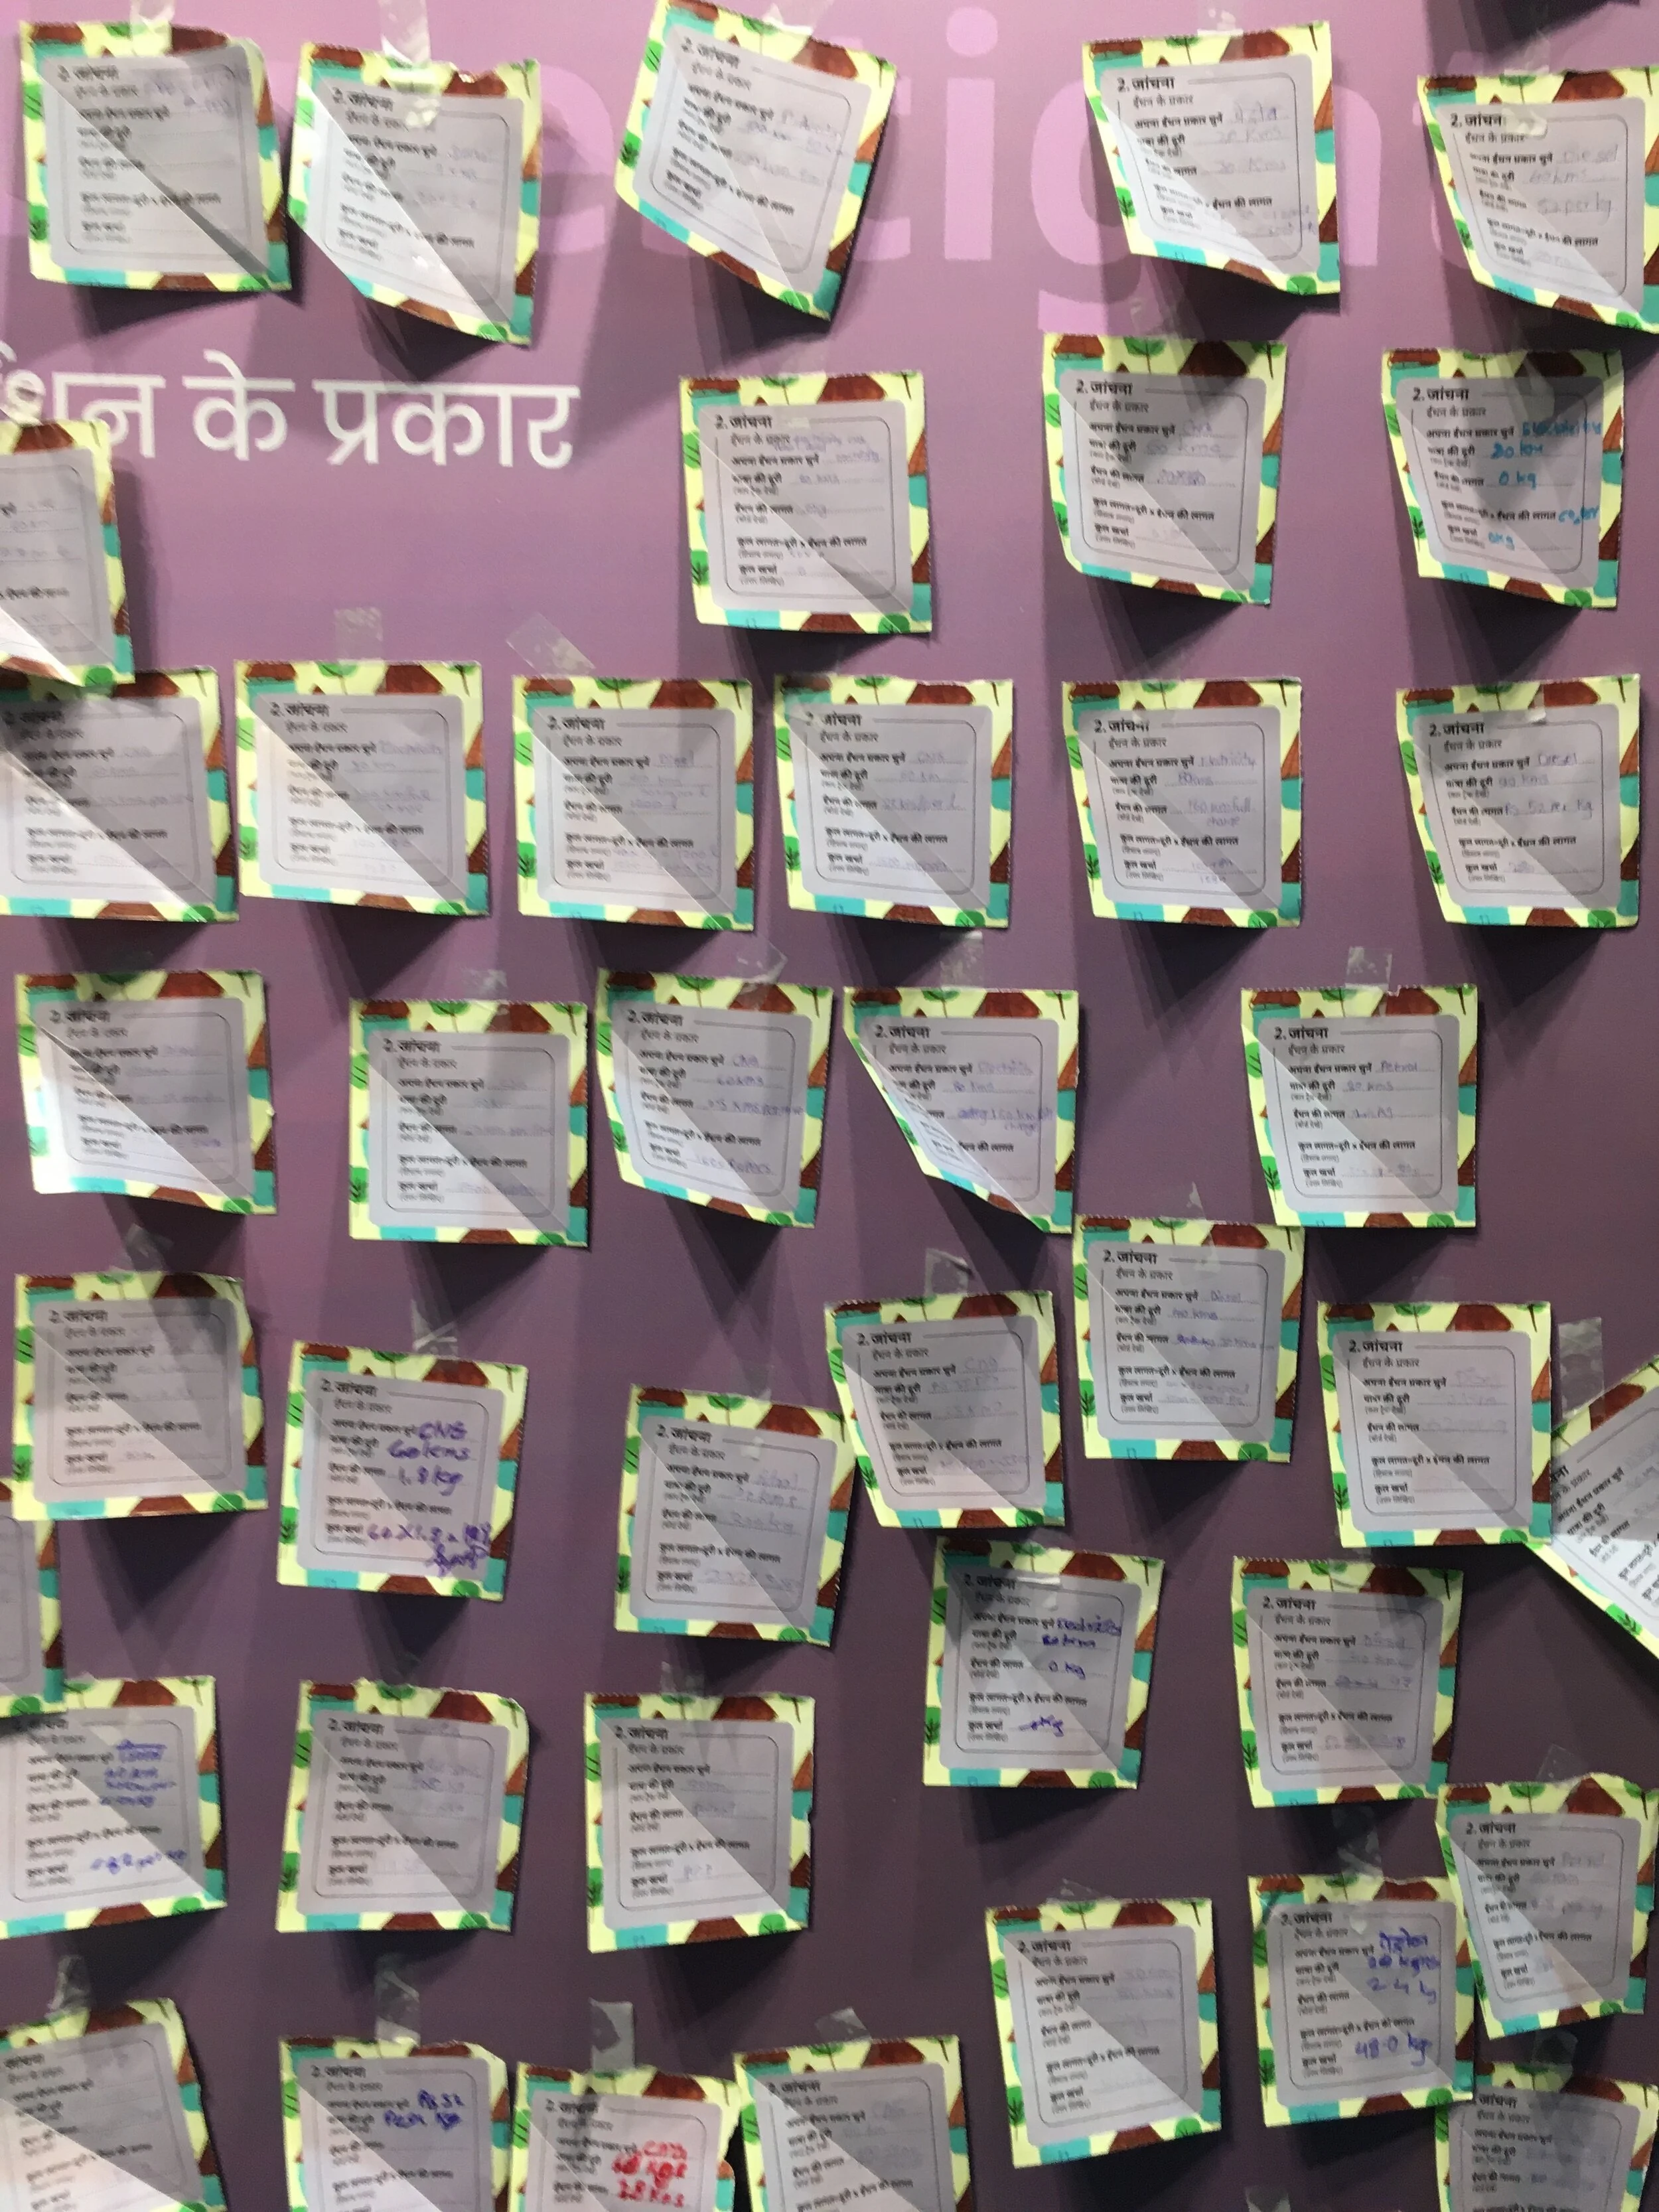
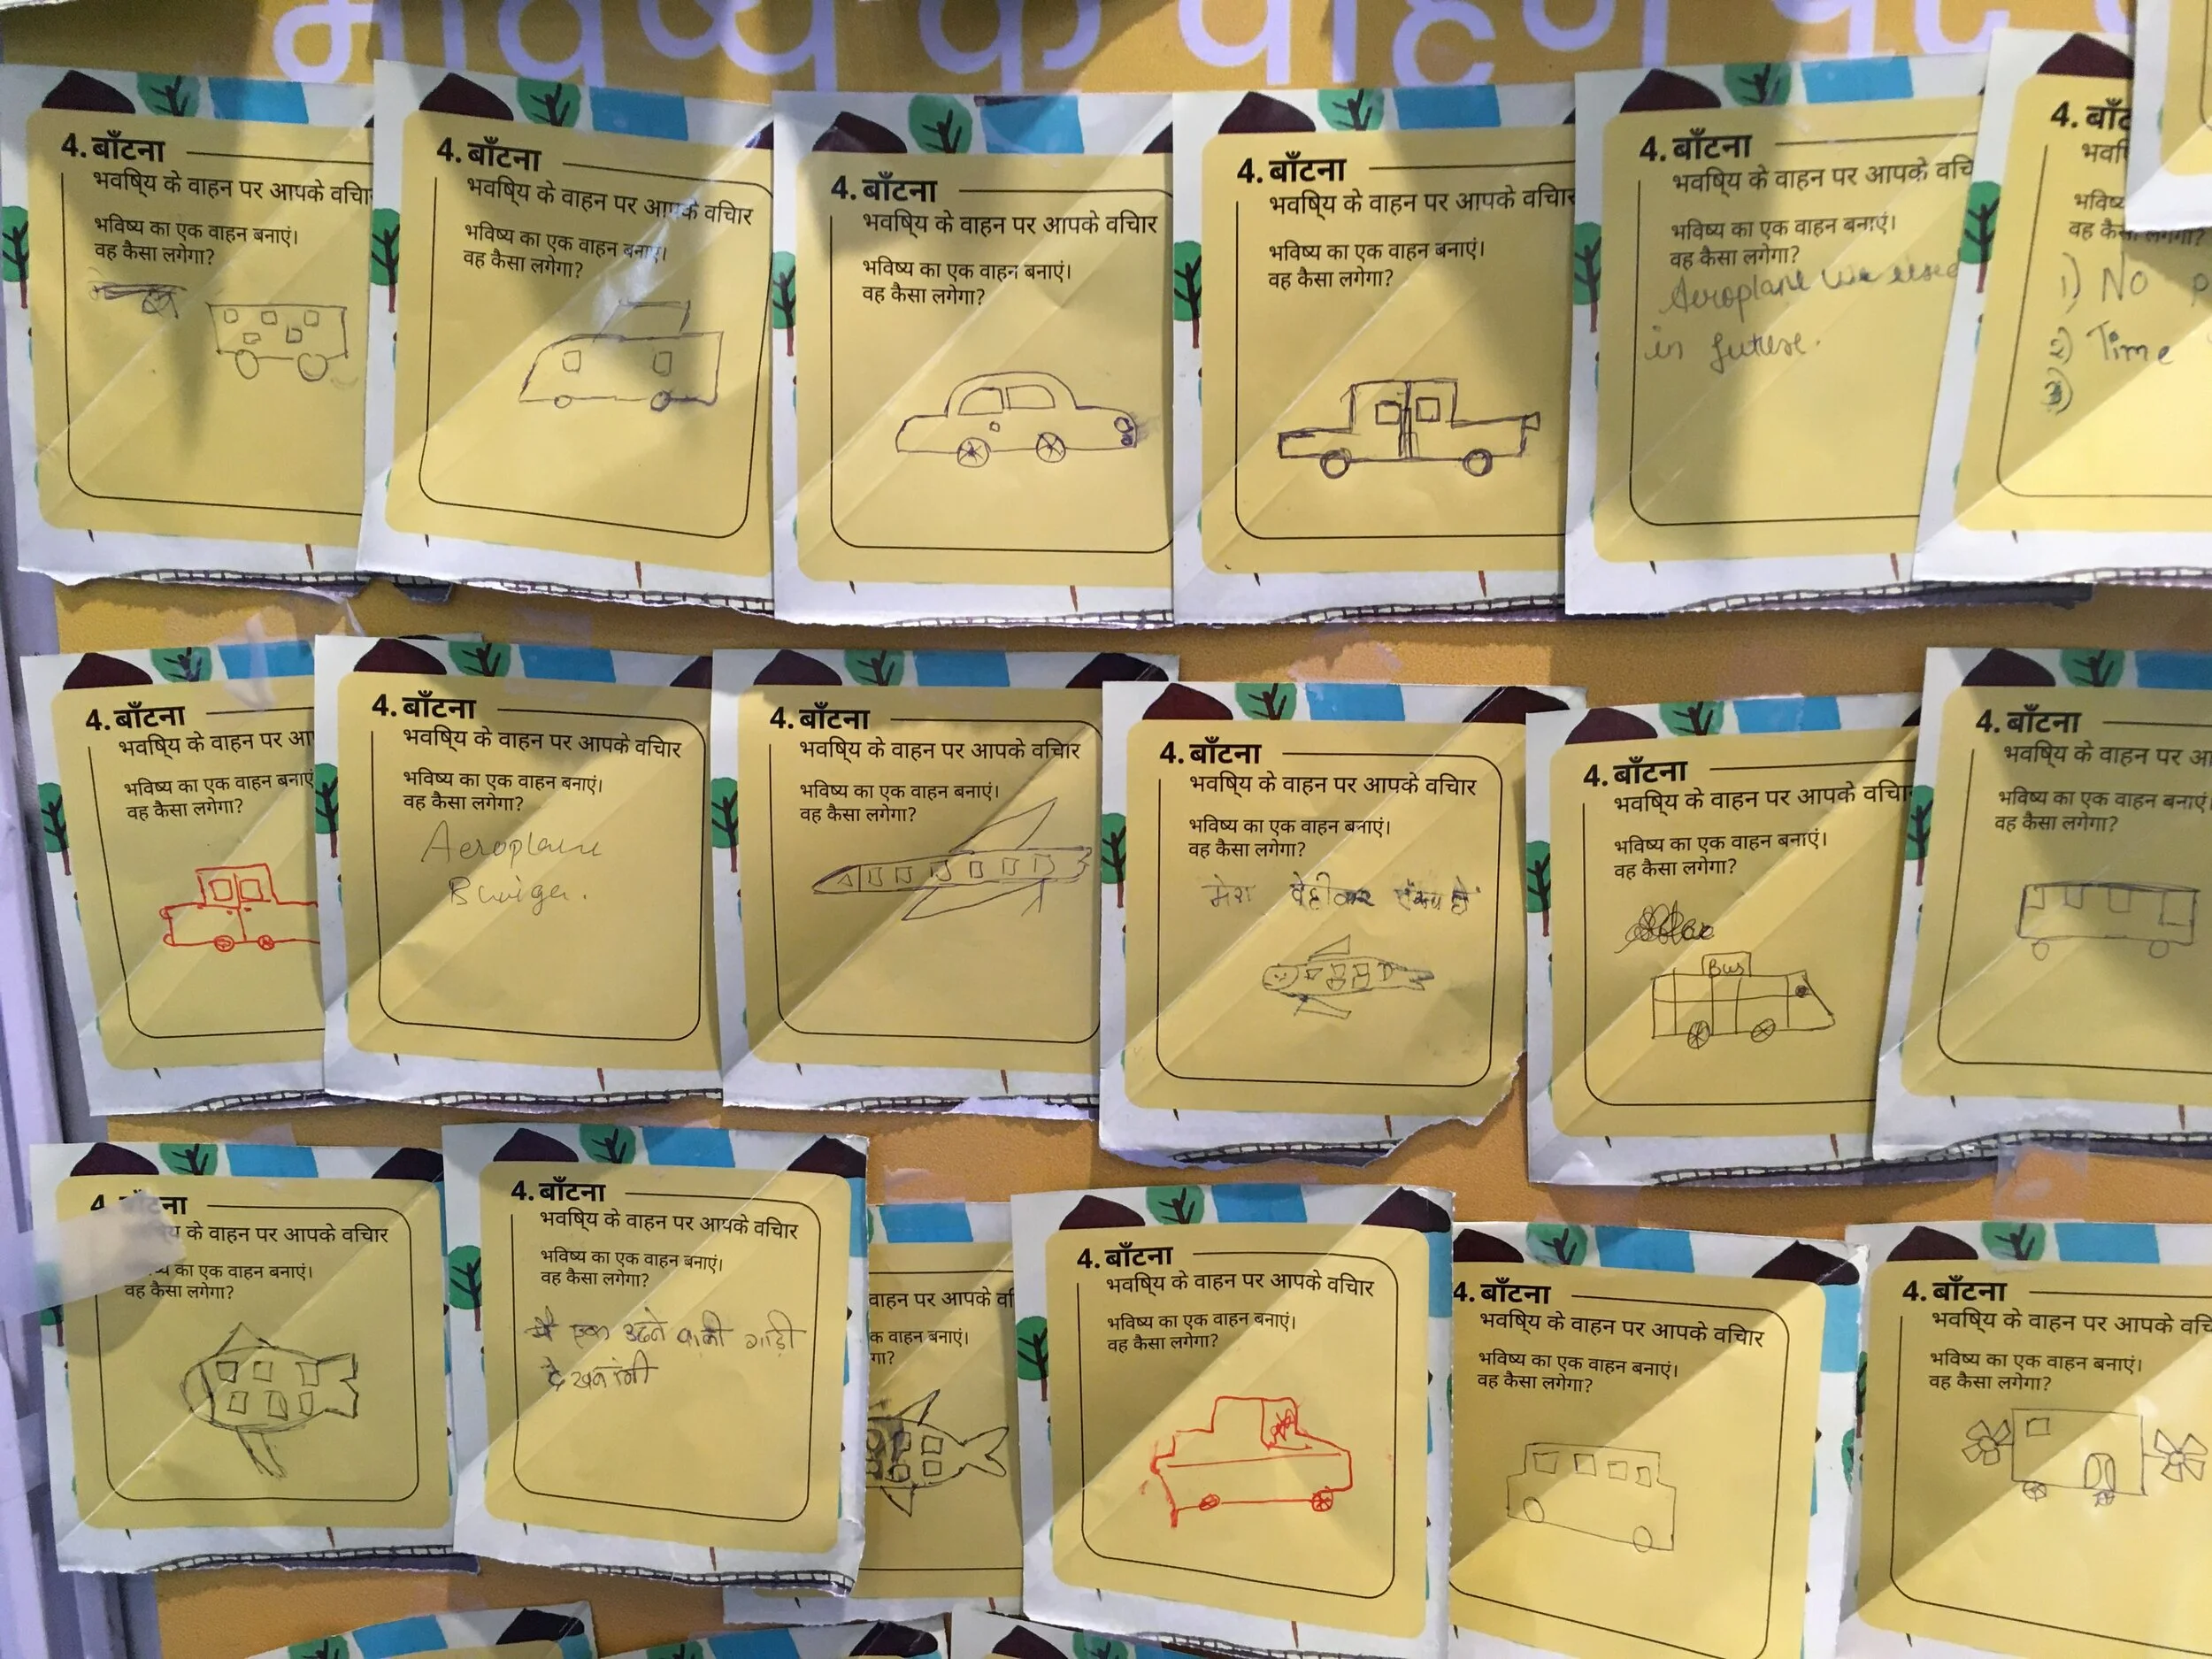
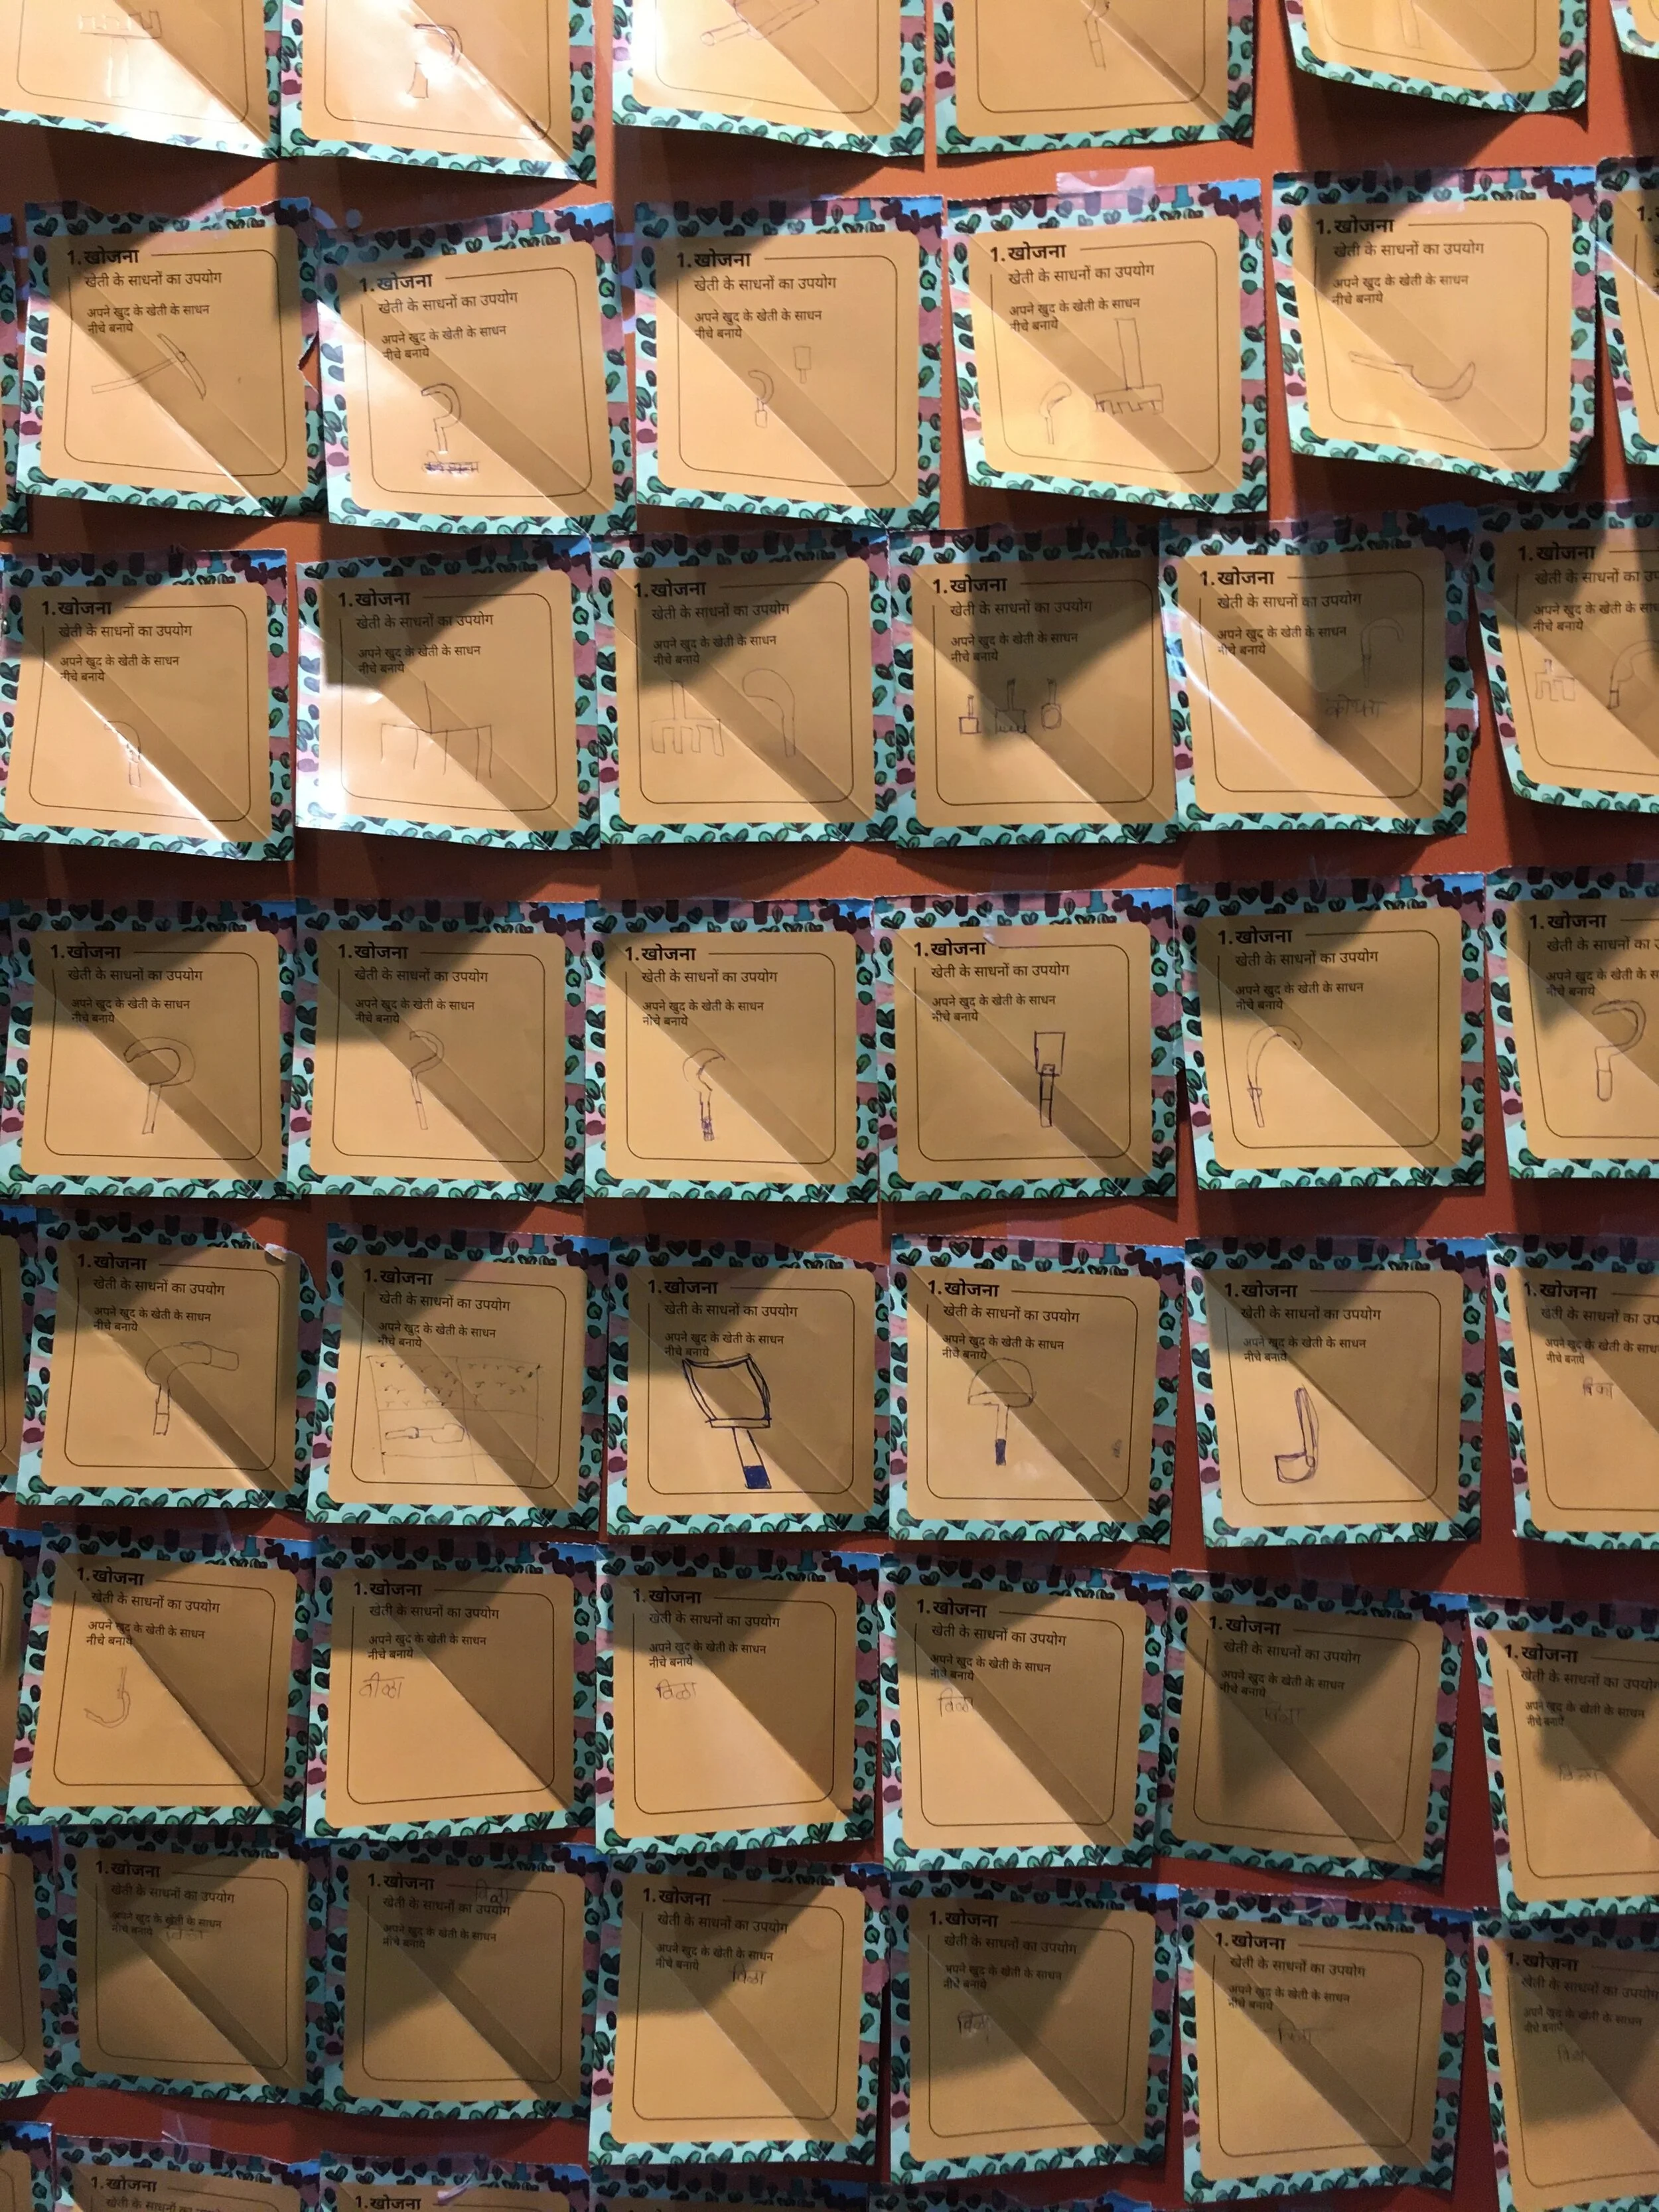
For instance, when they move to the irrigation wall, they can do a match the following of sorts, matching the wall with its respective irrigation method. In the farm tools section, they can probably fill out the names of tools. For the material wall section, they can write down why they chose a specific material and what shocking discovery they made, about the material etc.
This can be done for all the exhibits. The ultimate aim being that in addition to being a fun experience, we encourage children to reflect on their experience and gain some learning experience as well - learn a fun fact about each concept in an installation by ensuring that they put in down in a physical tangible form- either as doodles/ words or even as basic as encircling the right option in the worksheet.”
Mapping
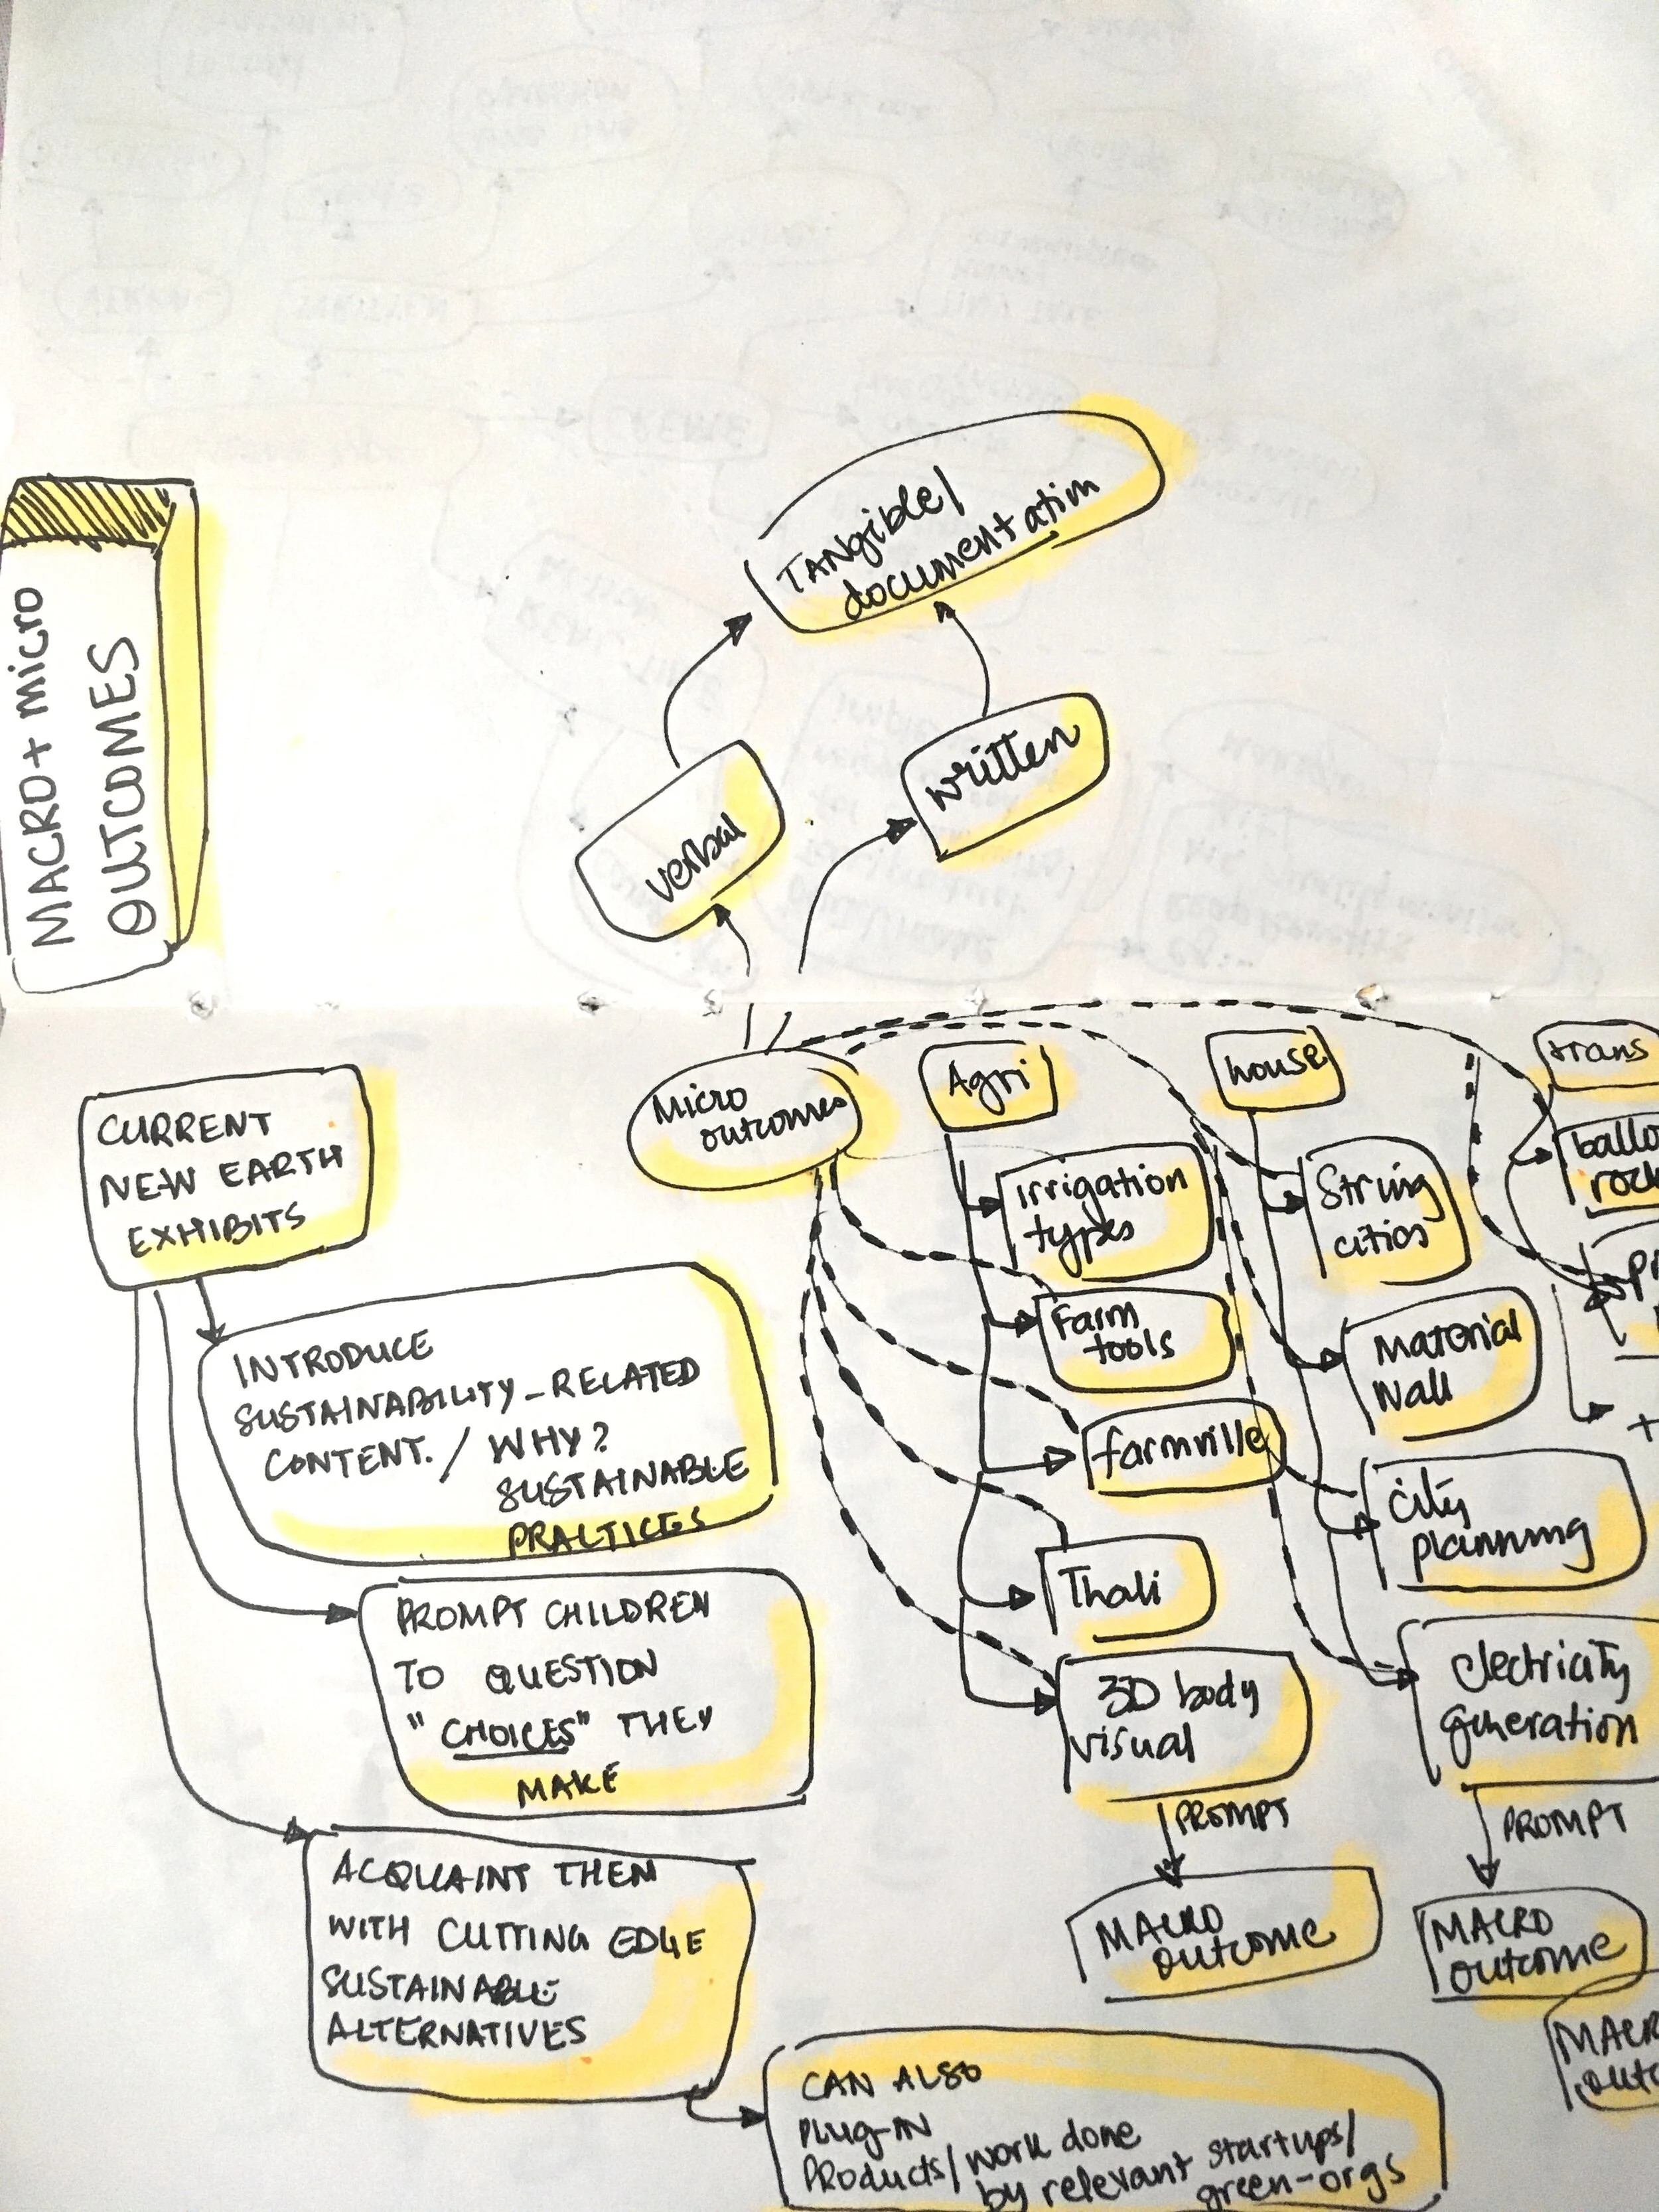
Started out mapping the Innovation carnival and various kinds of student interactions, tangible outcomes possible.

Research on theme for content
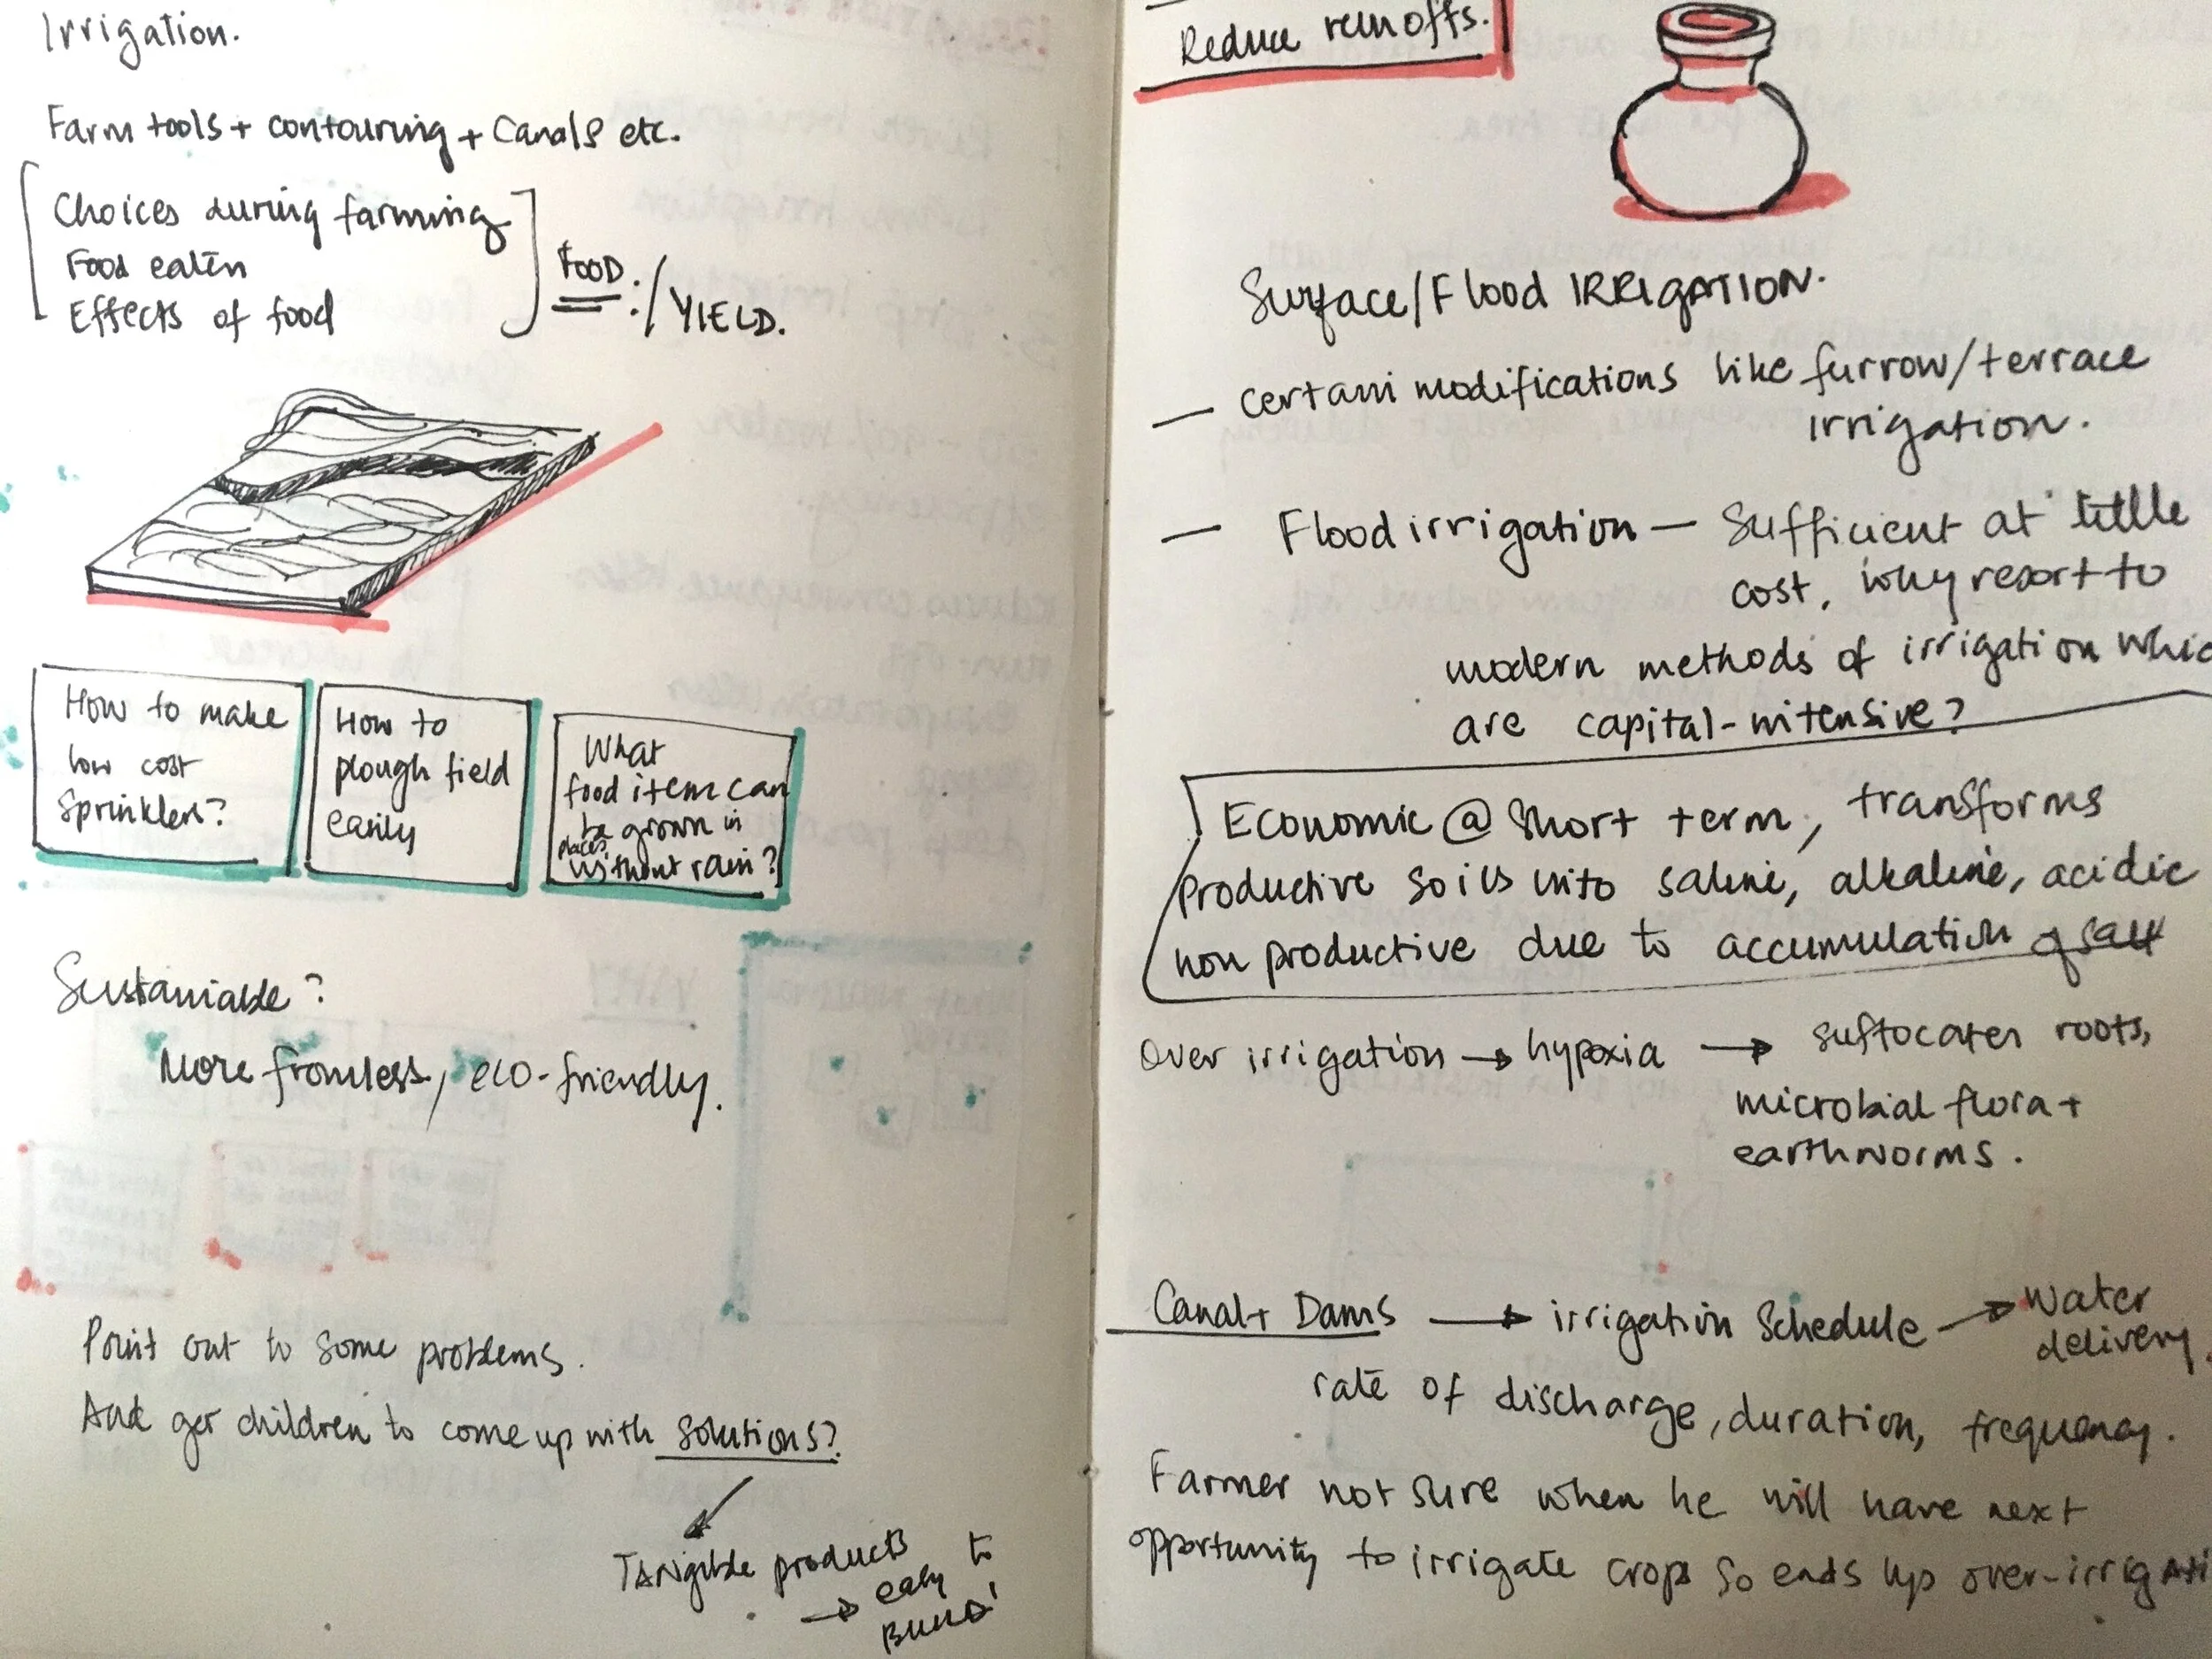
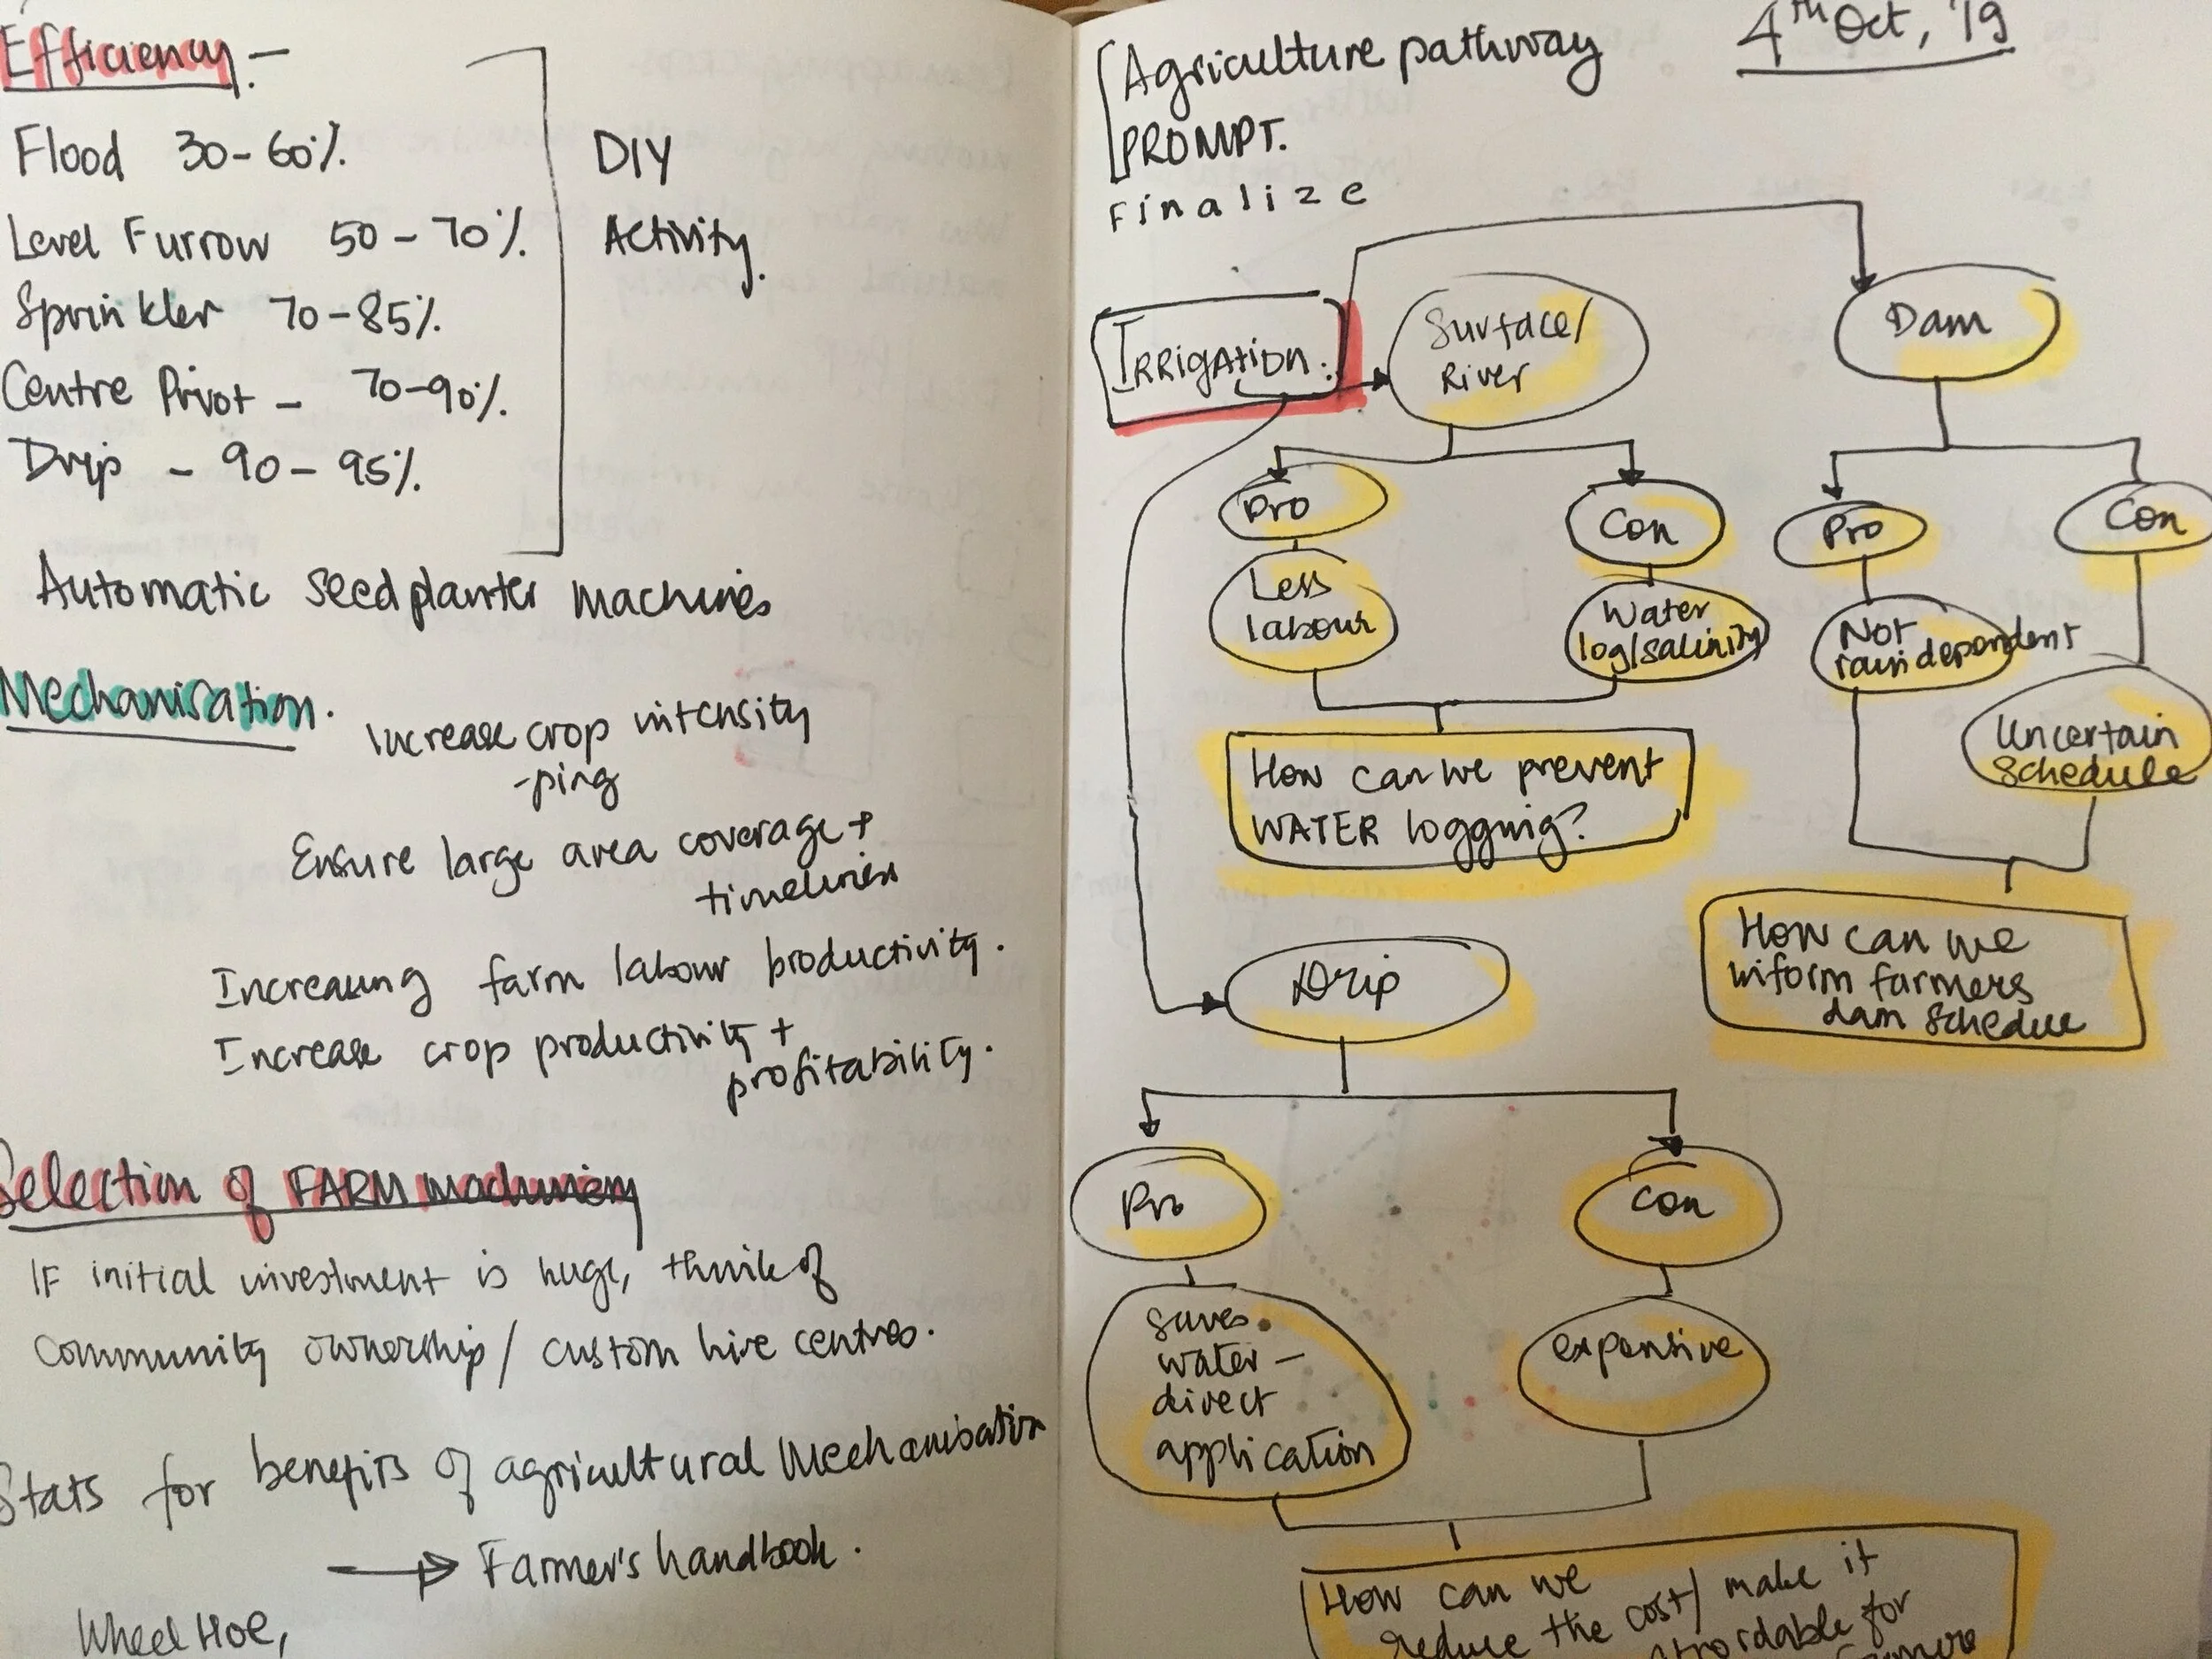
Listing down various issues in agriculture that can be addressed through sustainable methods/choices. Also, researched on sustainable techniques in agriculture like permaculture, remapping crops, pros and cons of various irrigation methods, mulching, trap crops for pest control, wind breaking, fire control through vegetation and sustainable practices followed in India etc.


Contextualising to fit with existing Agastya interactive installations
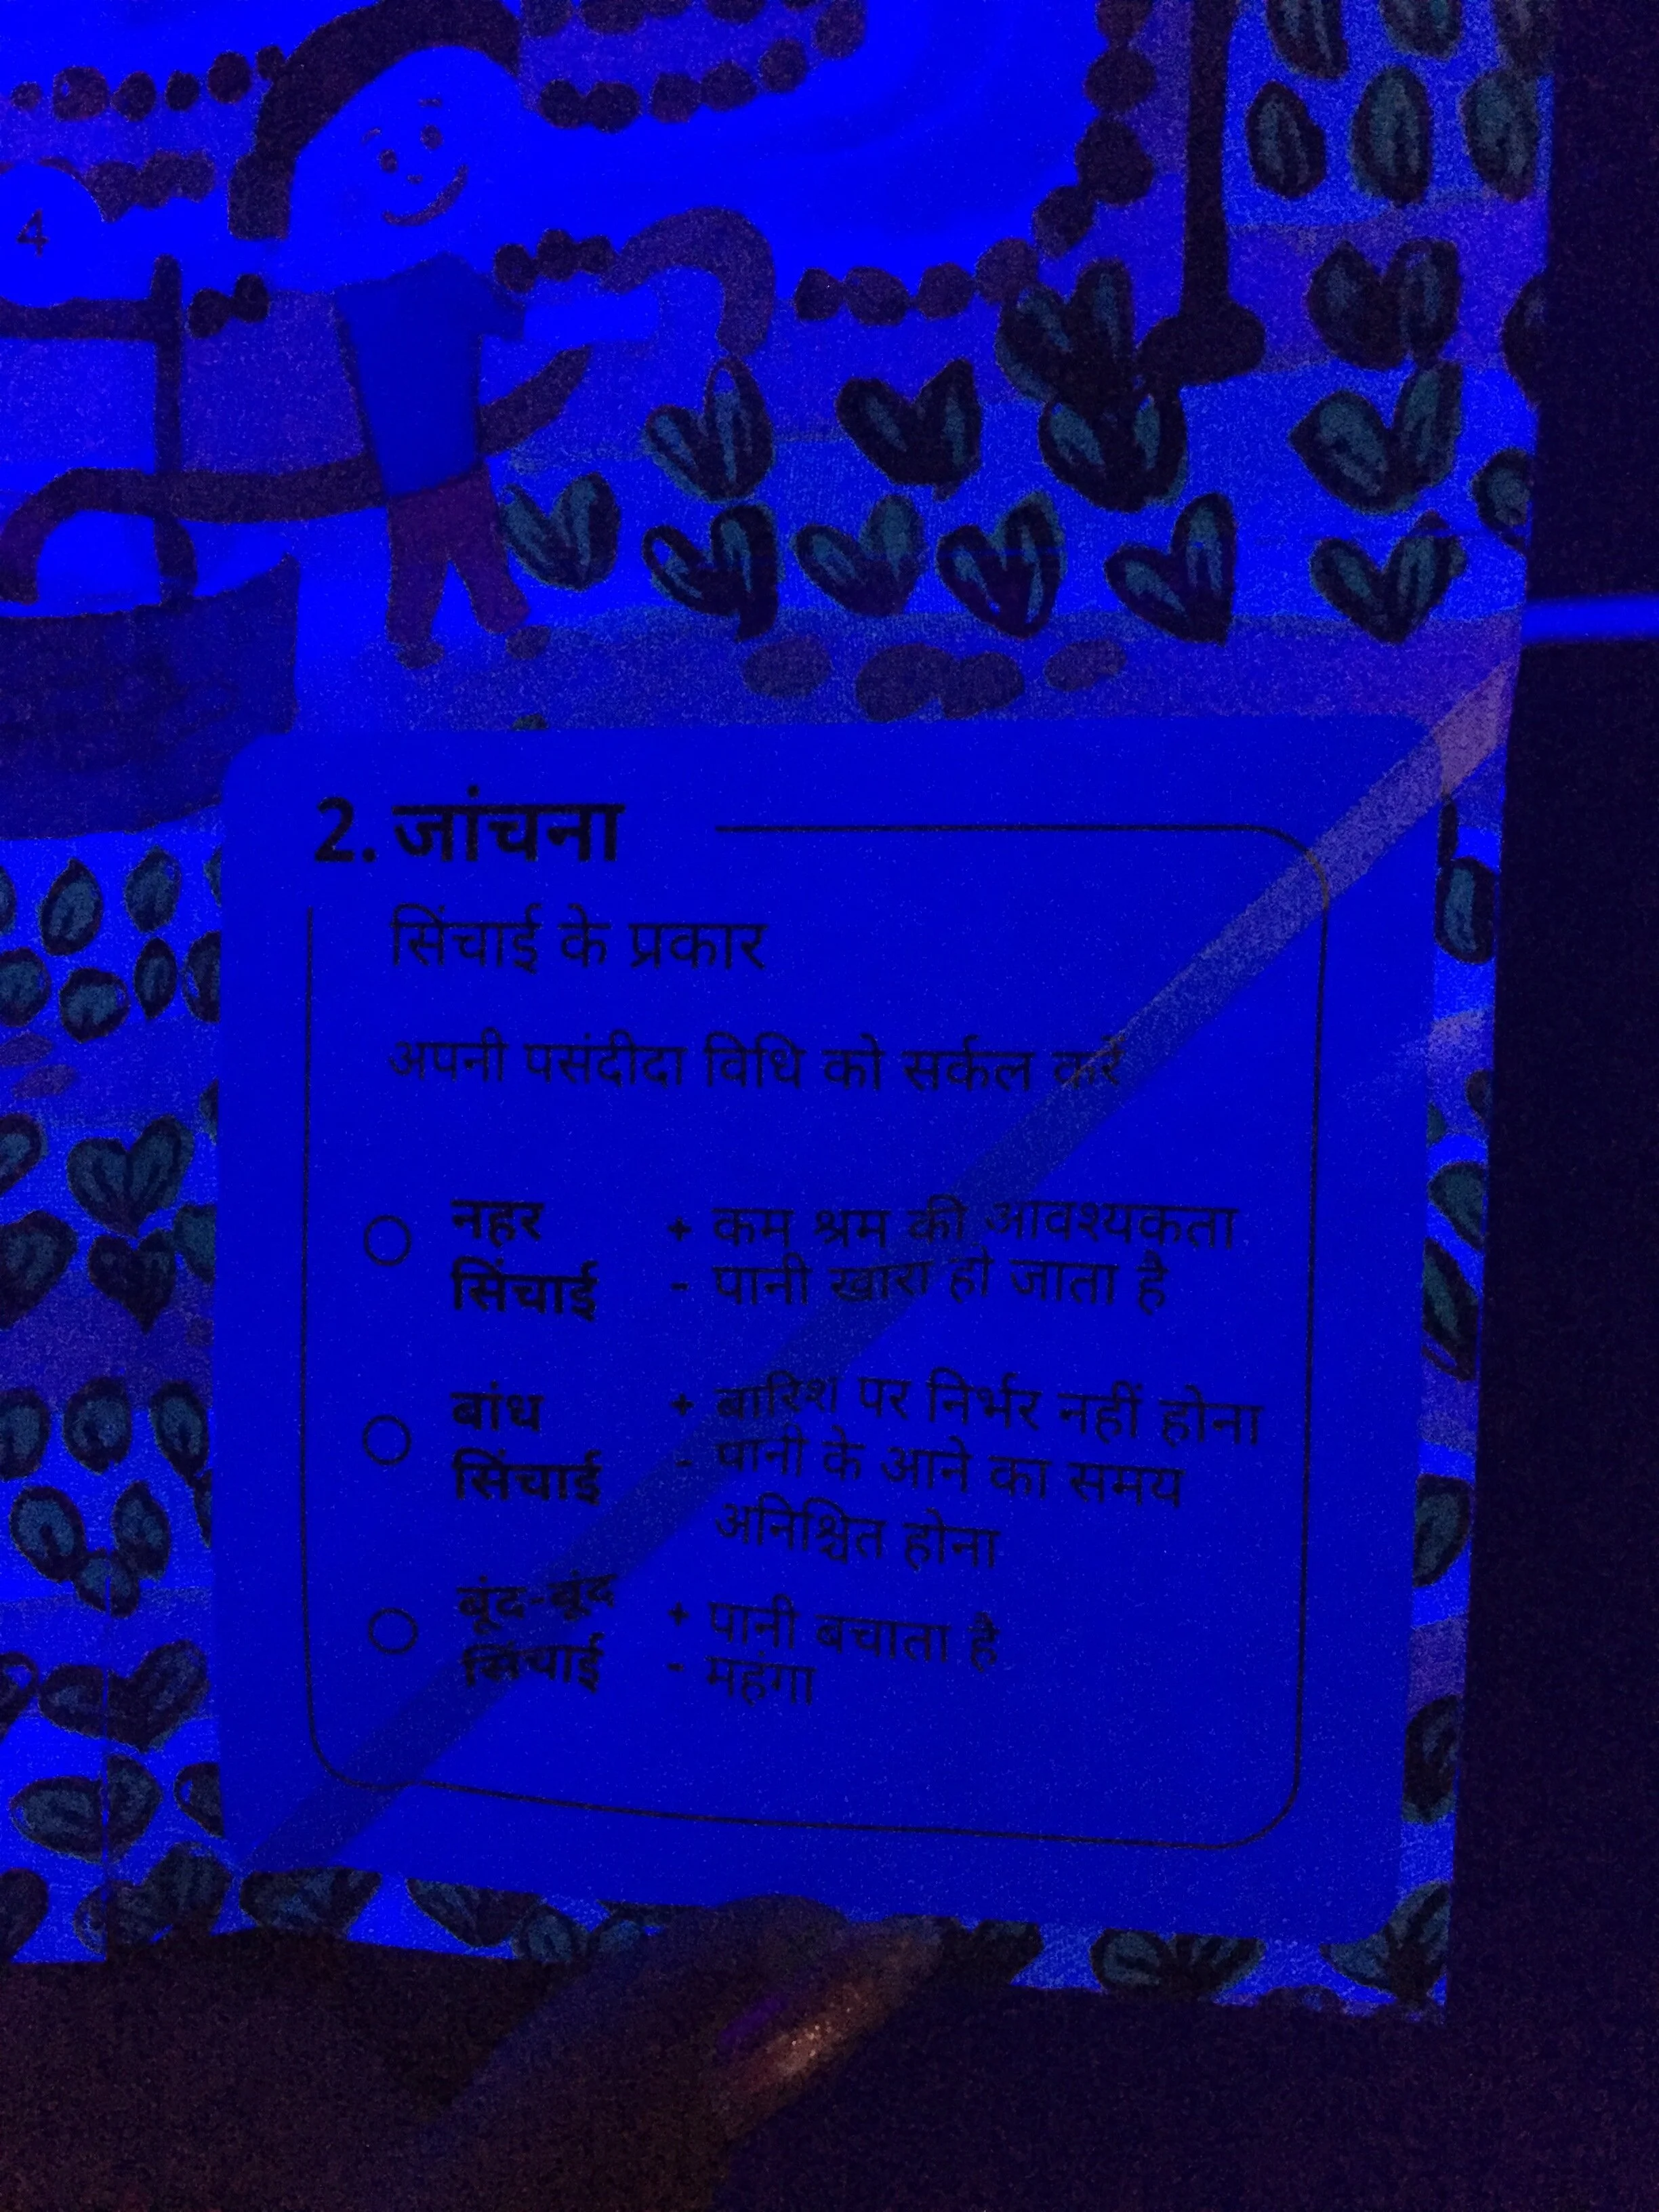
The next step was to align specific content with each of the existing exhibits. For instance, the exhibit on irrigation walls displays three techniques: surface, dam and drip irrigation. I listed out pros and cons for each of these techniques. The idea was to allow children to make a choice of technique after they have been carefully exposed to the pros and cons of each methods. After all, sustainability is about making careful weighted choices.
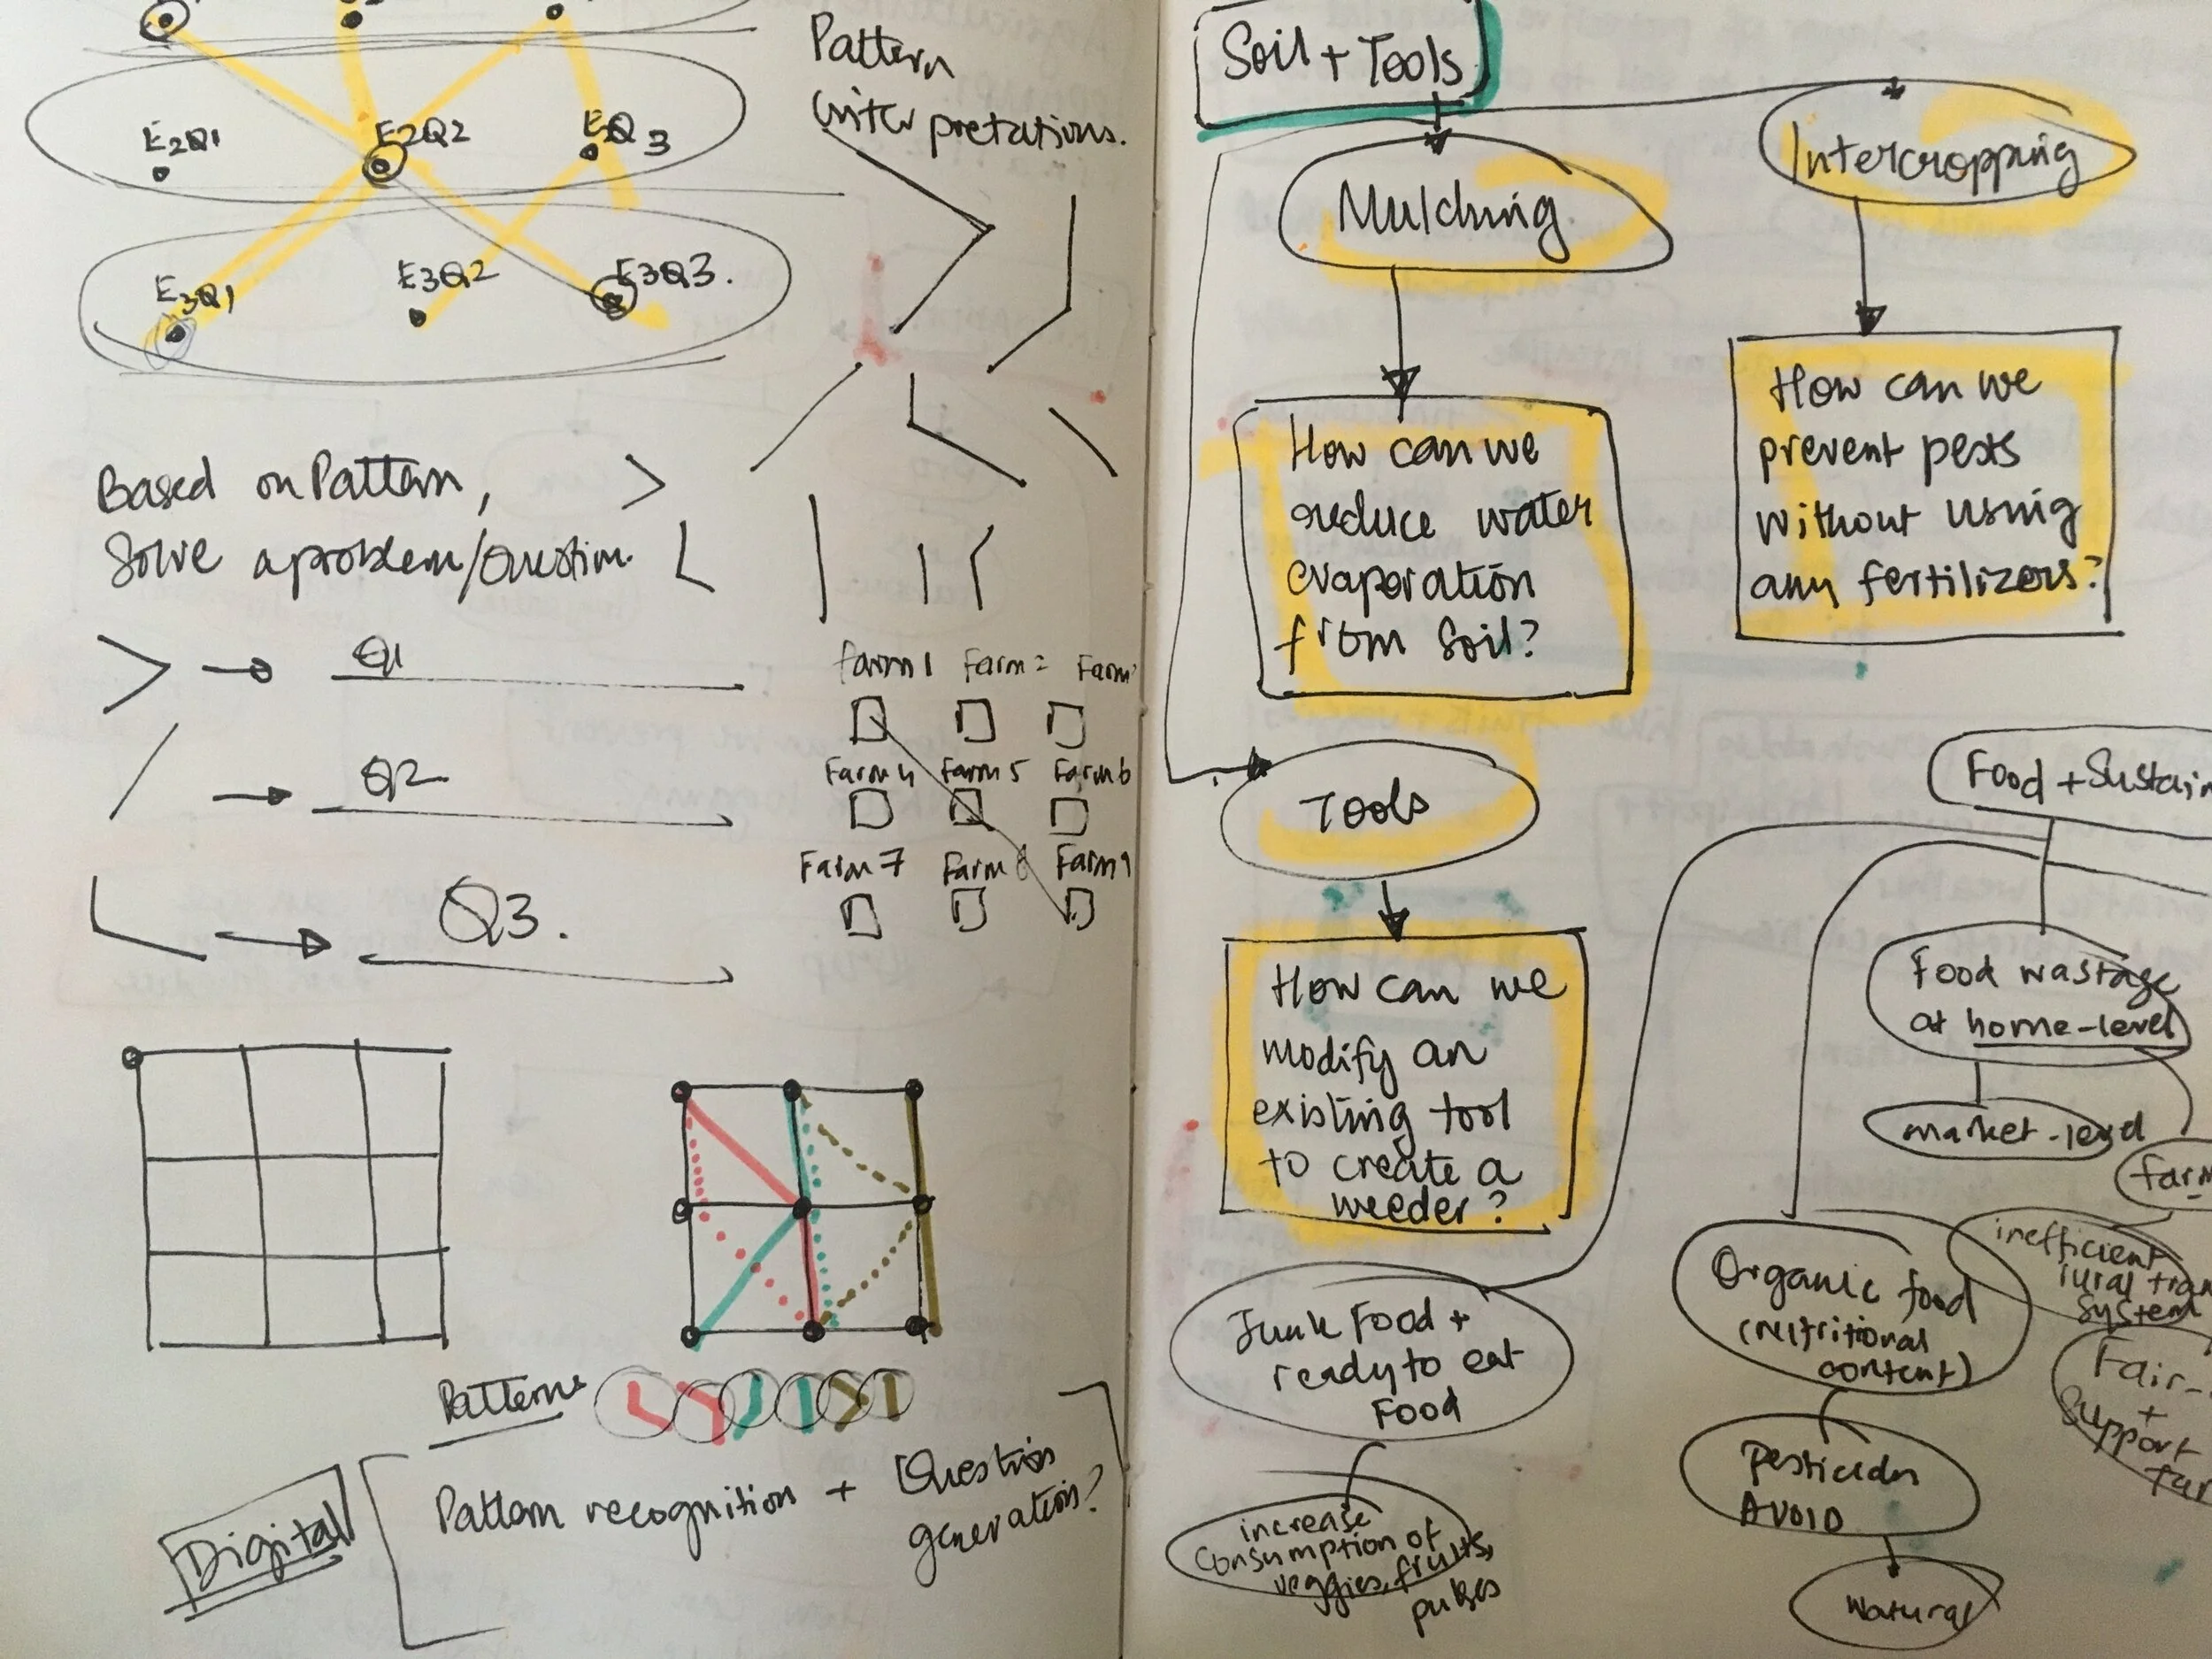
IDEA 1.0
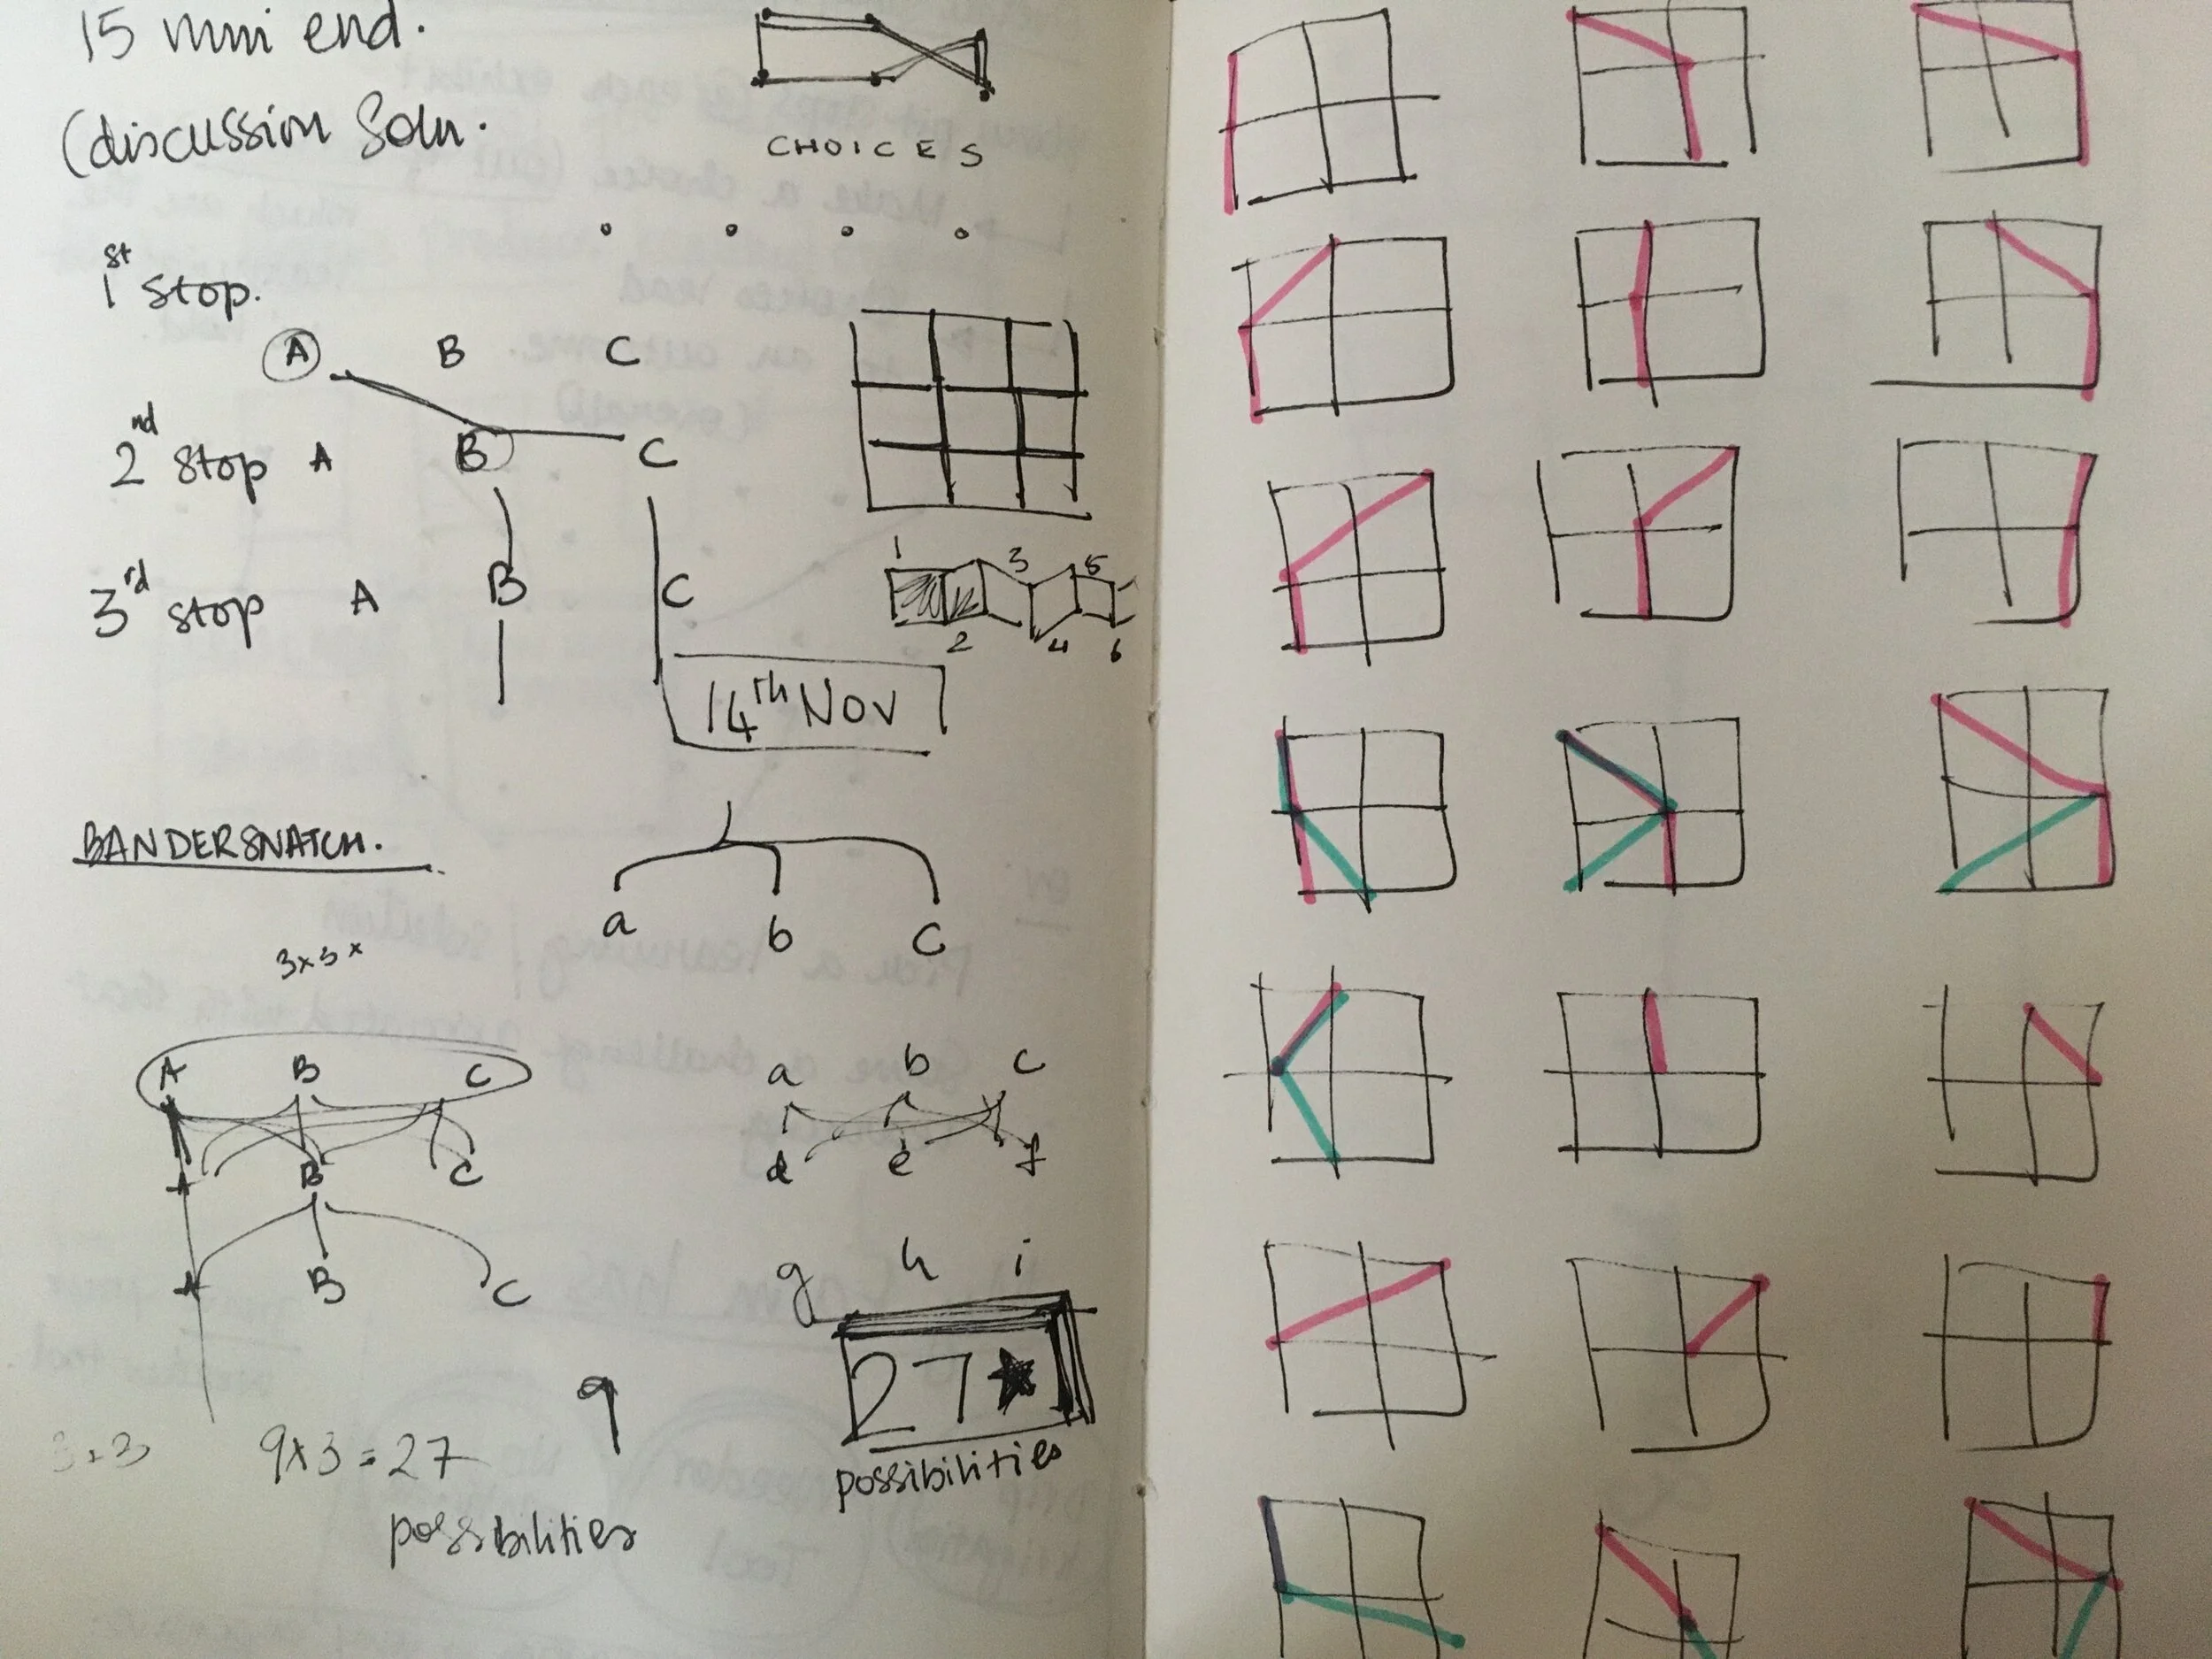
The map/ worksheet will contain a 3x3 grid/ matrix layout of dots. Each dot represents an option/ choice. There are three problems that the kids need to find/choose a solution for. Each problem has three choices. Hence, the 3x3 matrix. One kids circle their respective choices, they connect the corresponding dots to create a pattern. This pattern can then be scanned through the QR code technique to display a unique result based on the choices made. This way, kids get to see the consequences of the choices they’ve made. And there’s no one right or wrong answer, as in the real world.
IDEA 2.0
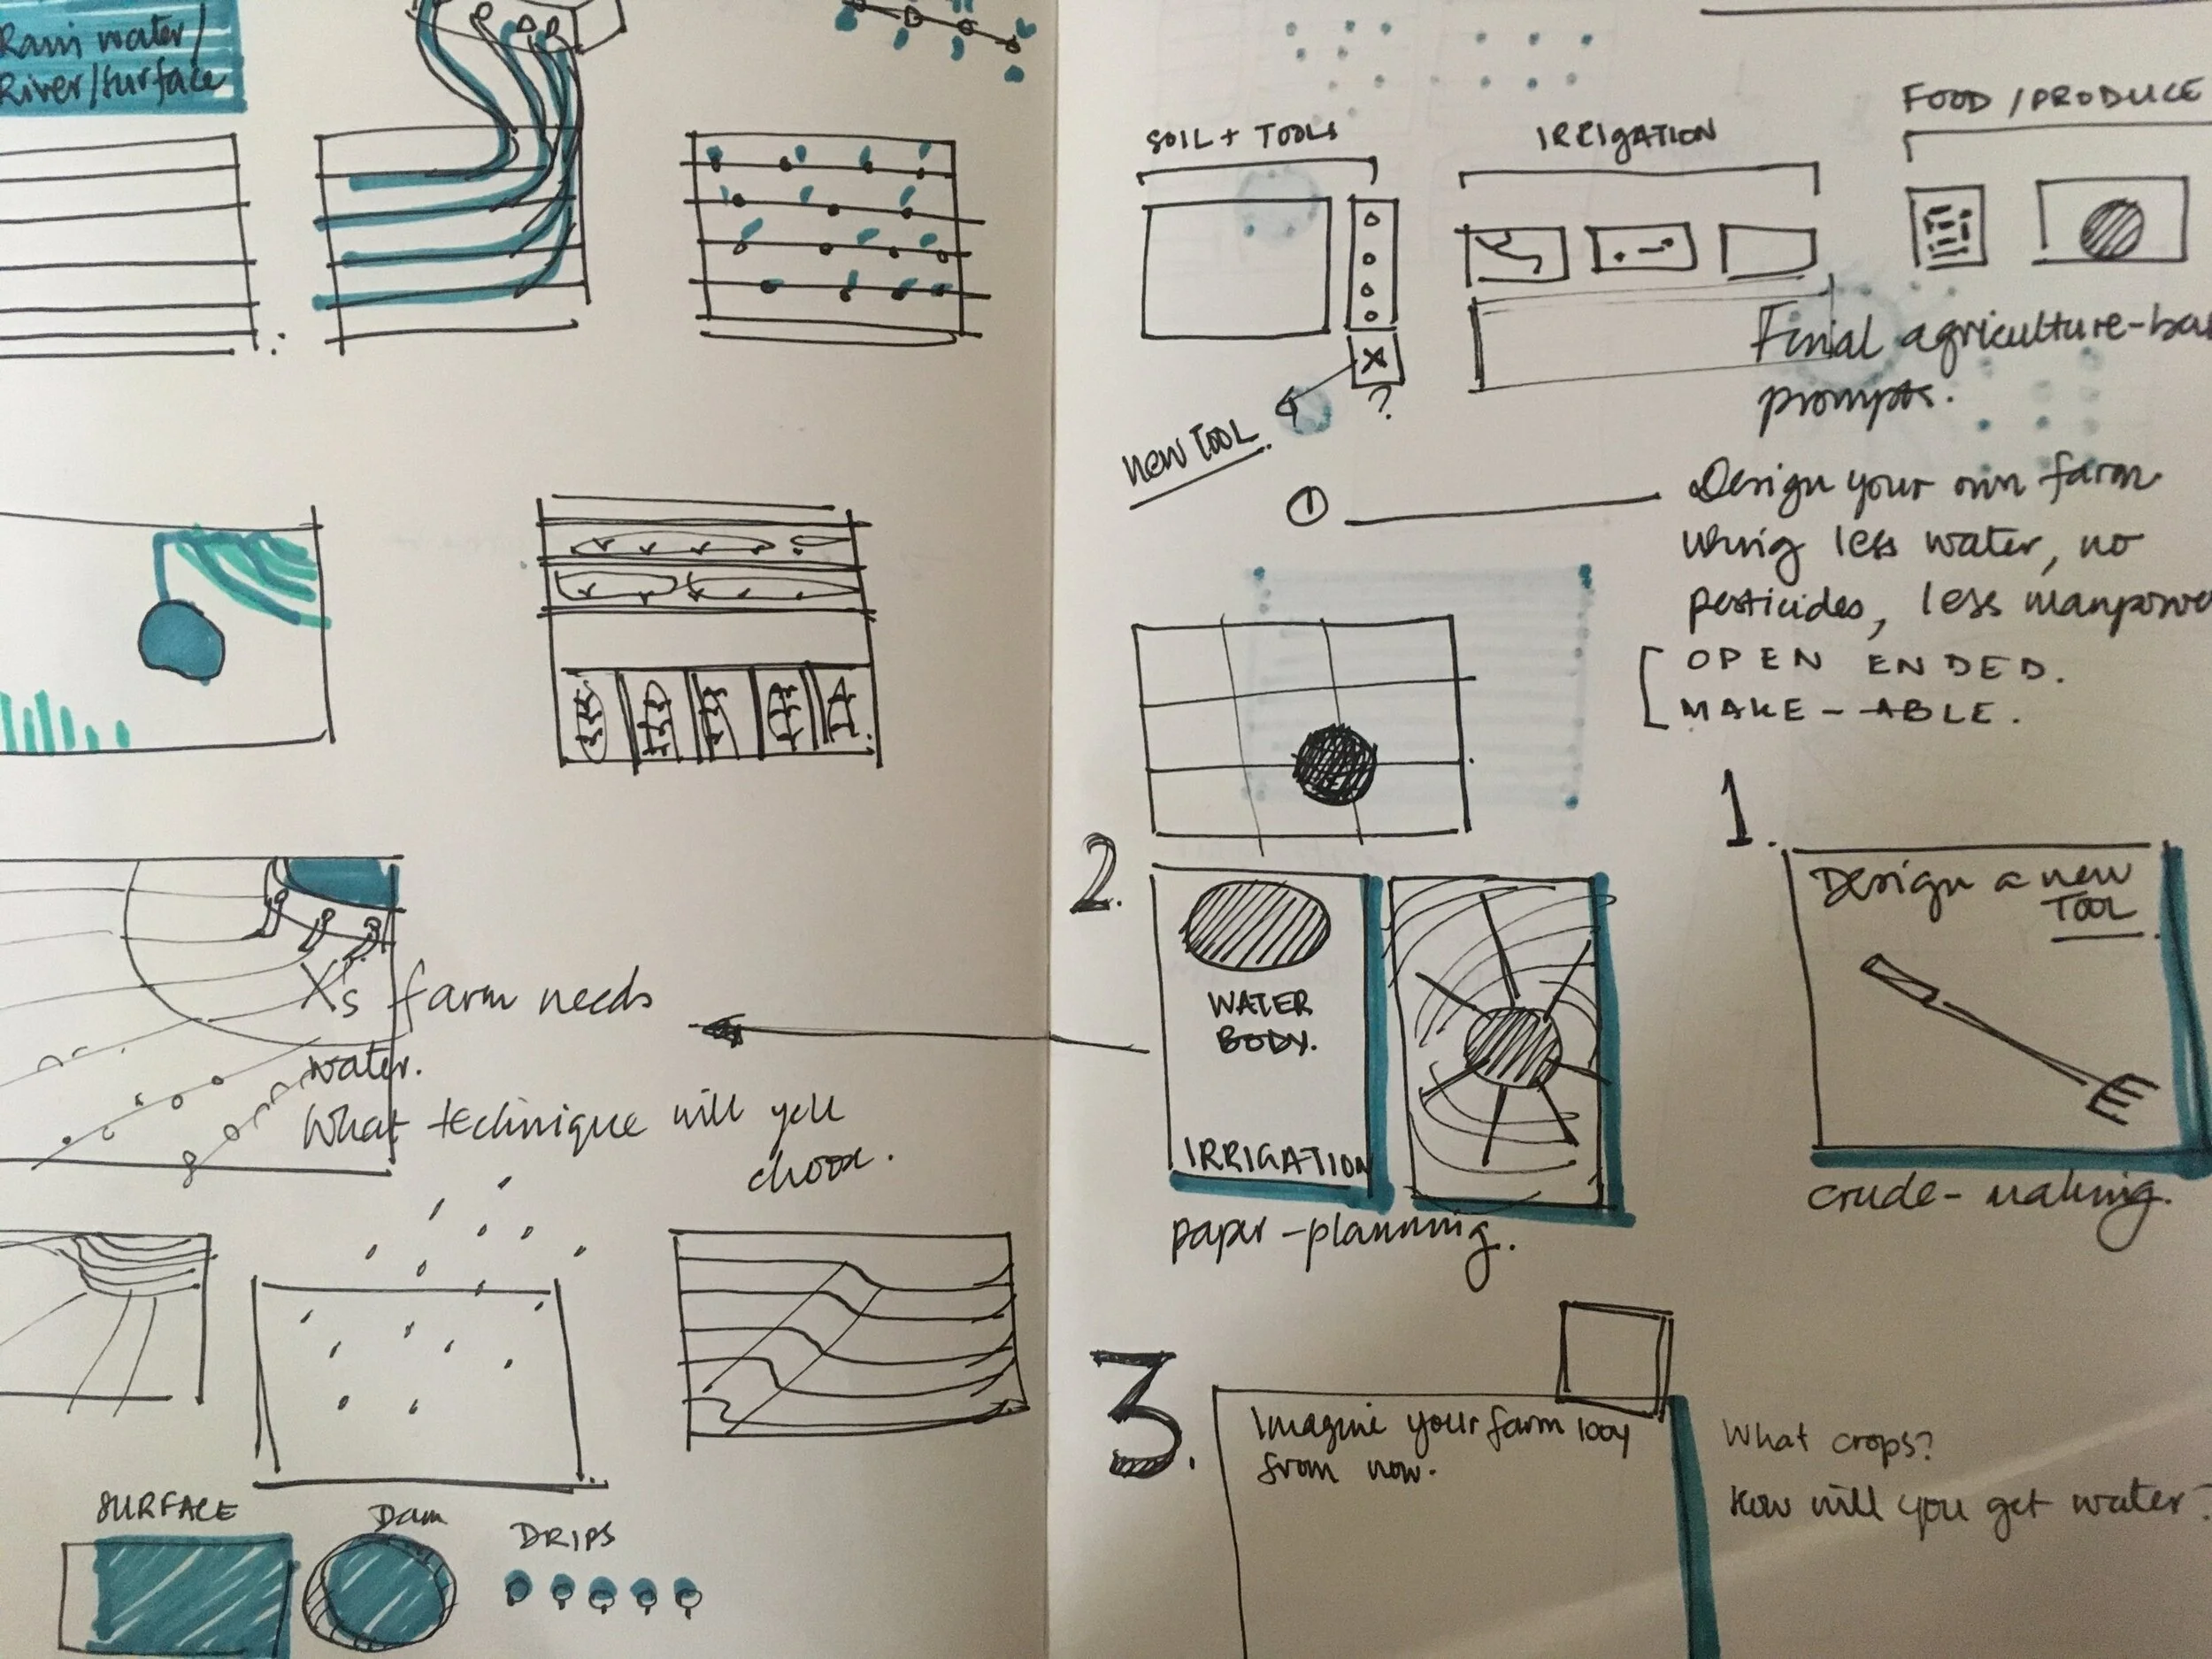
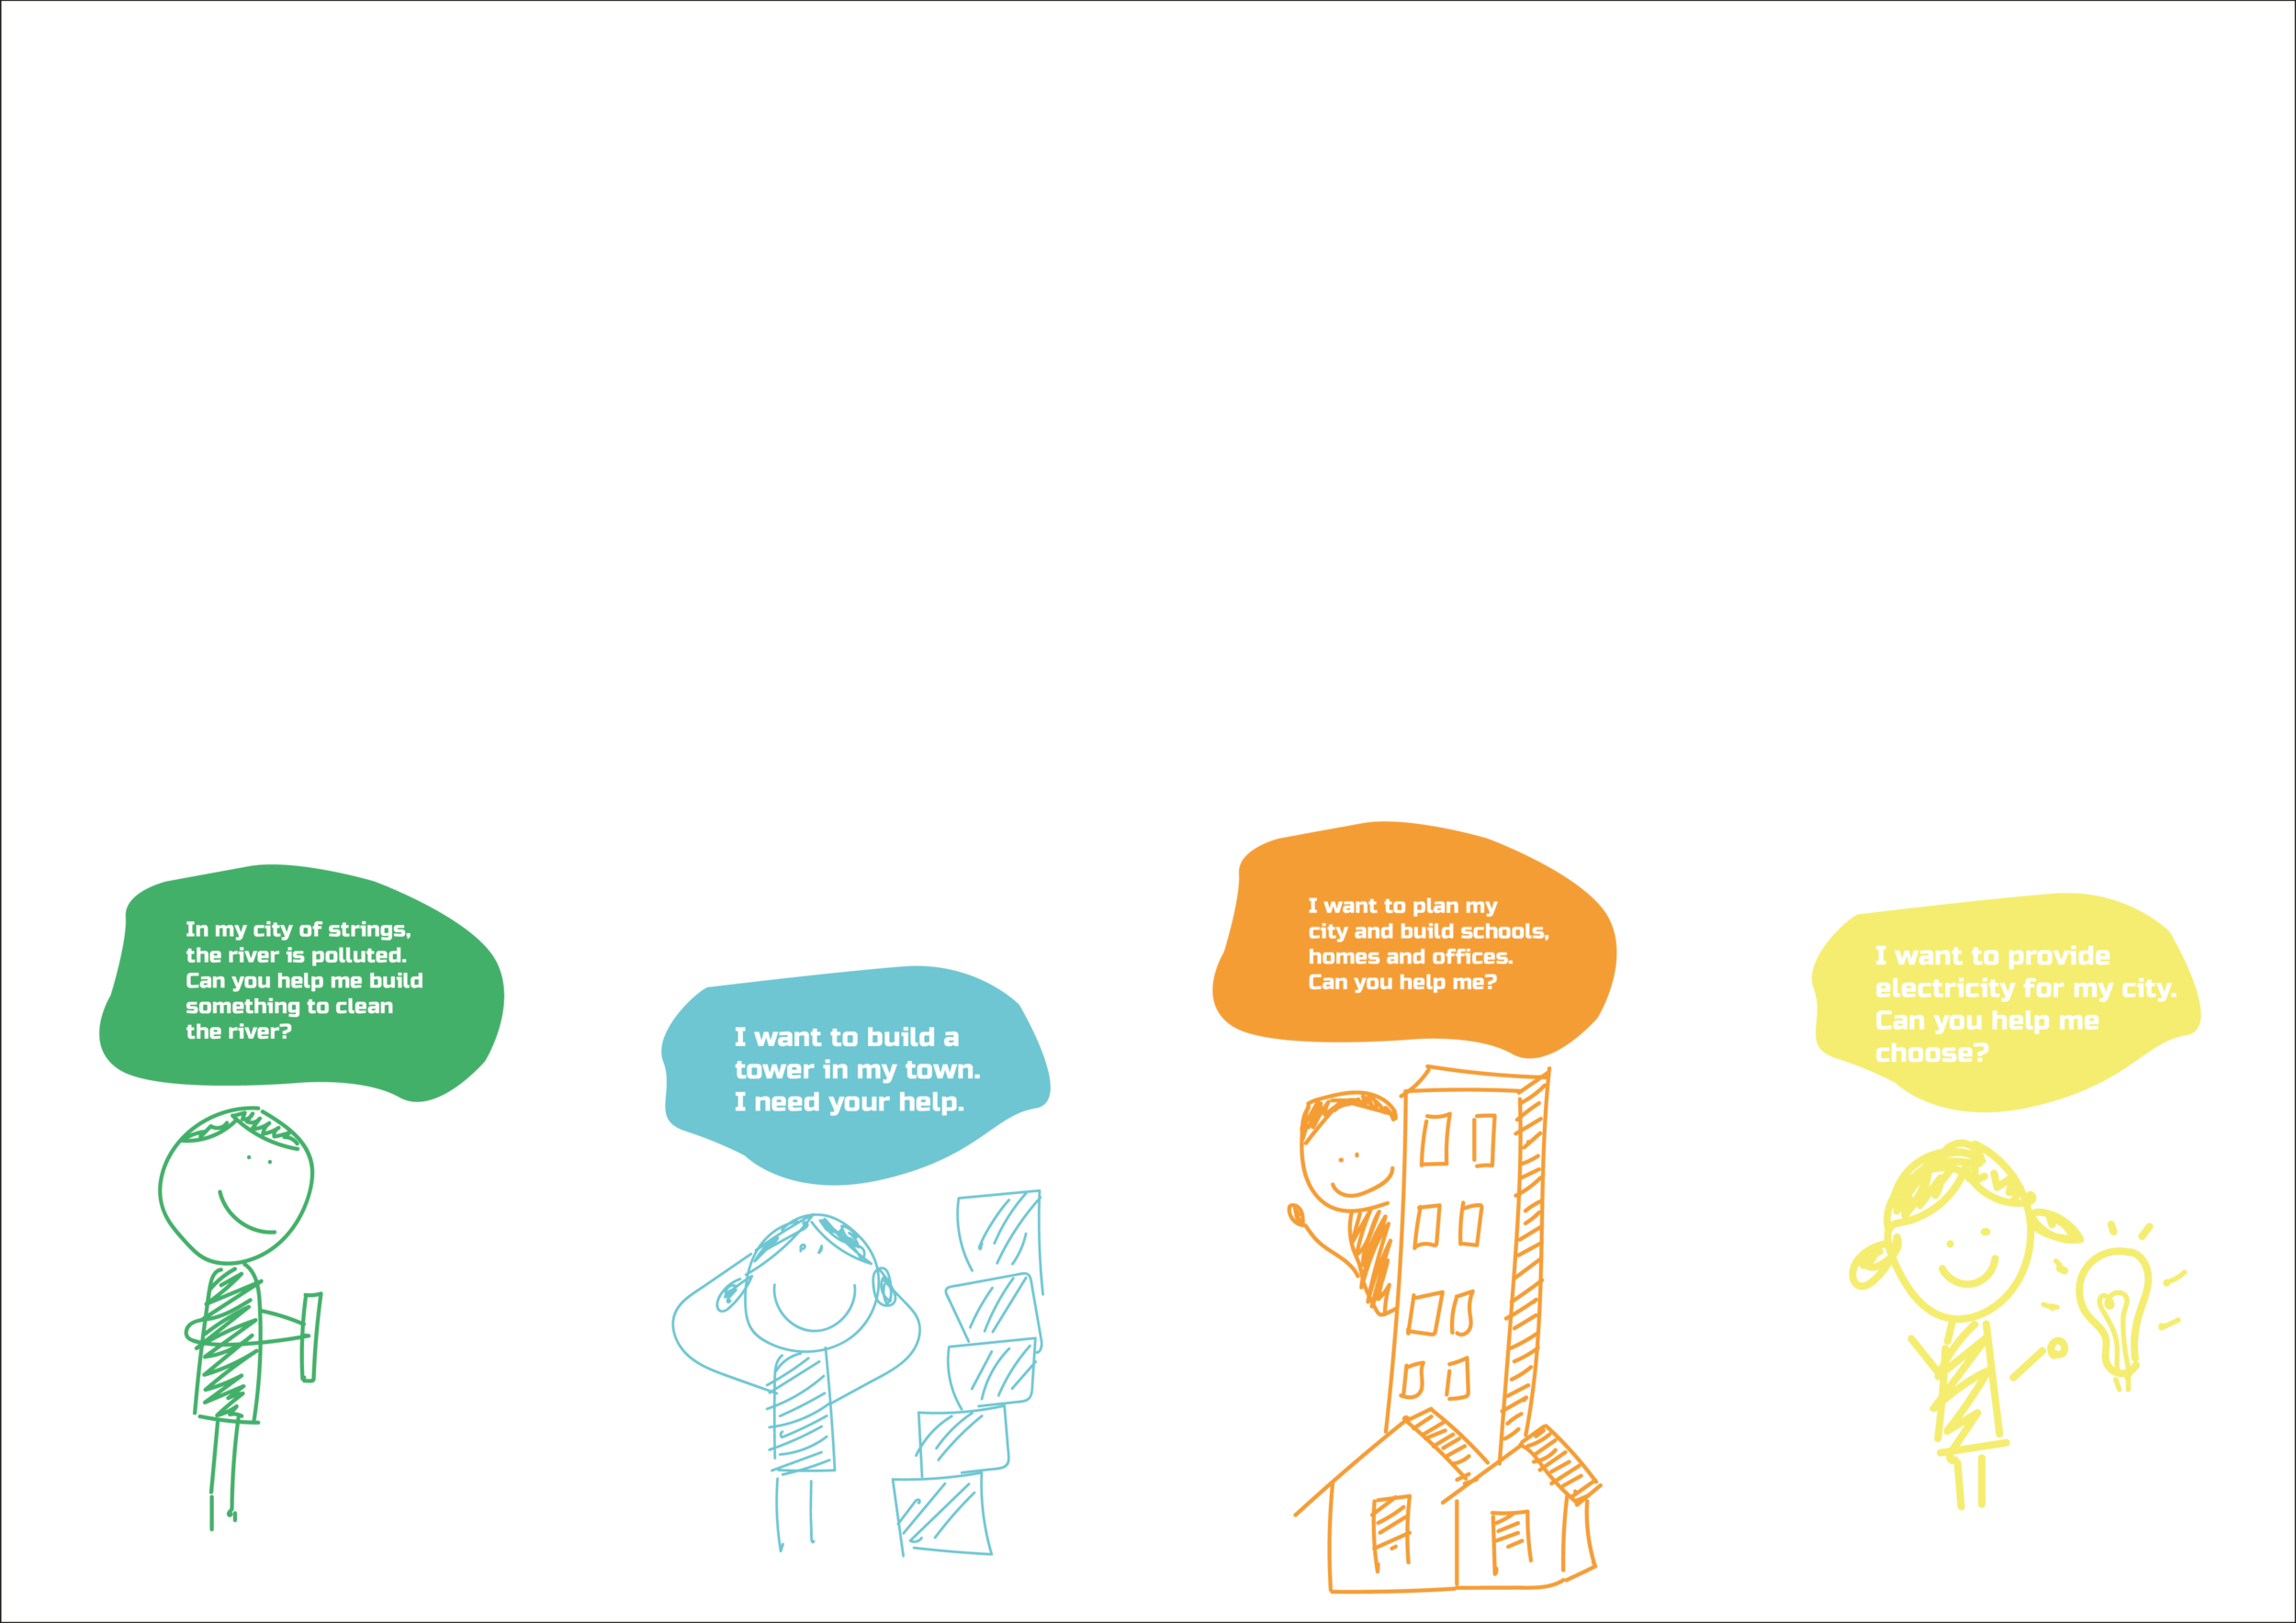
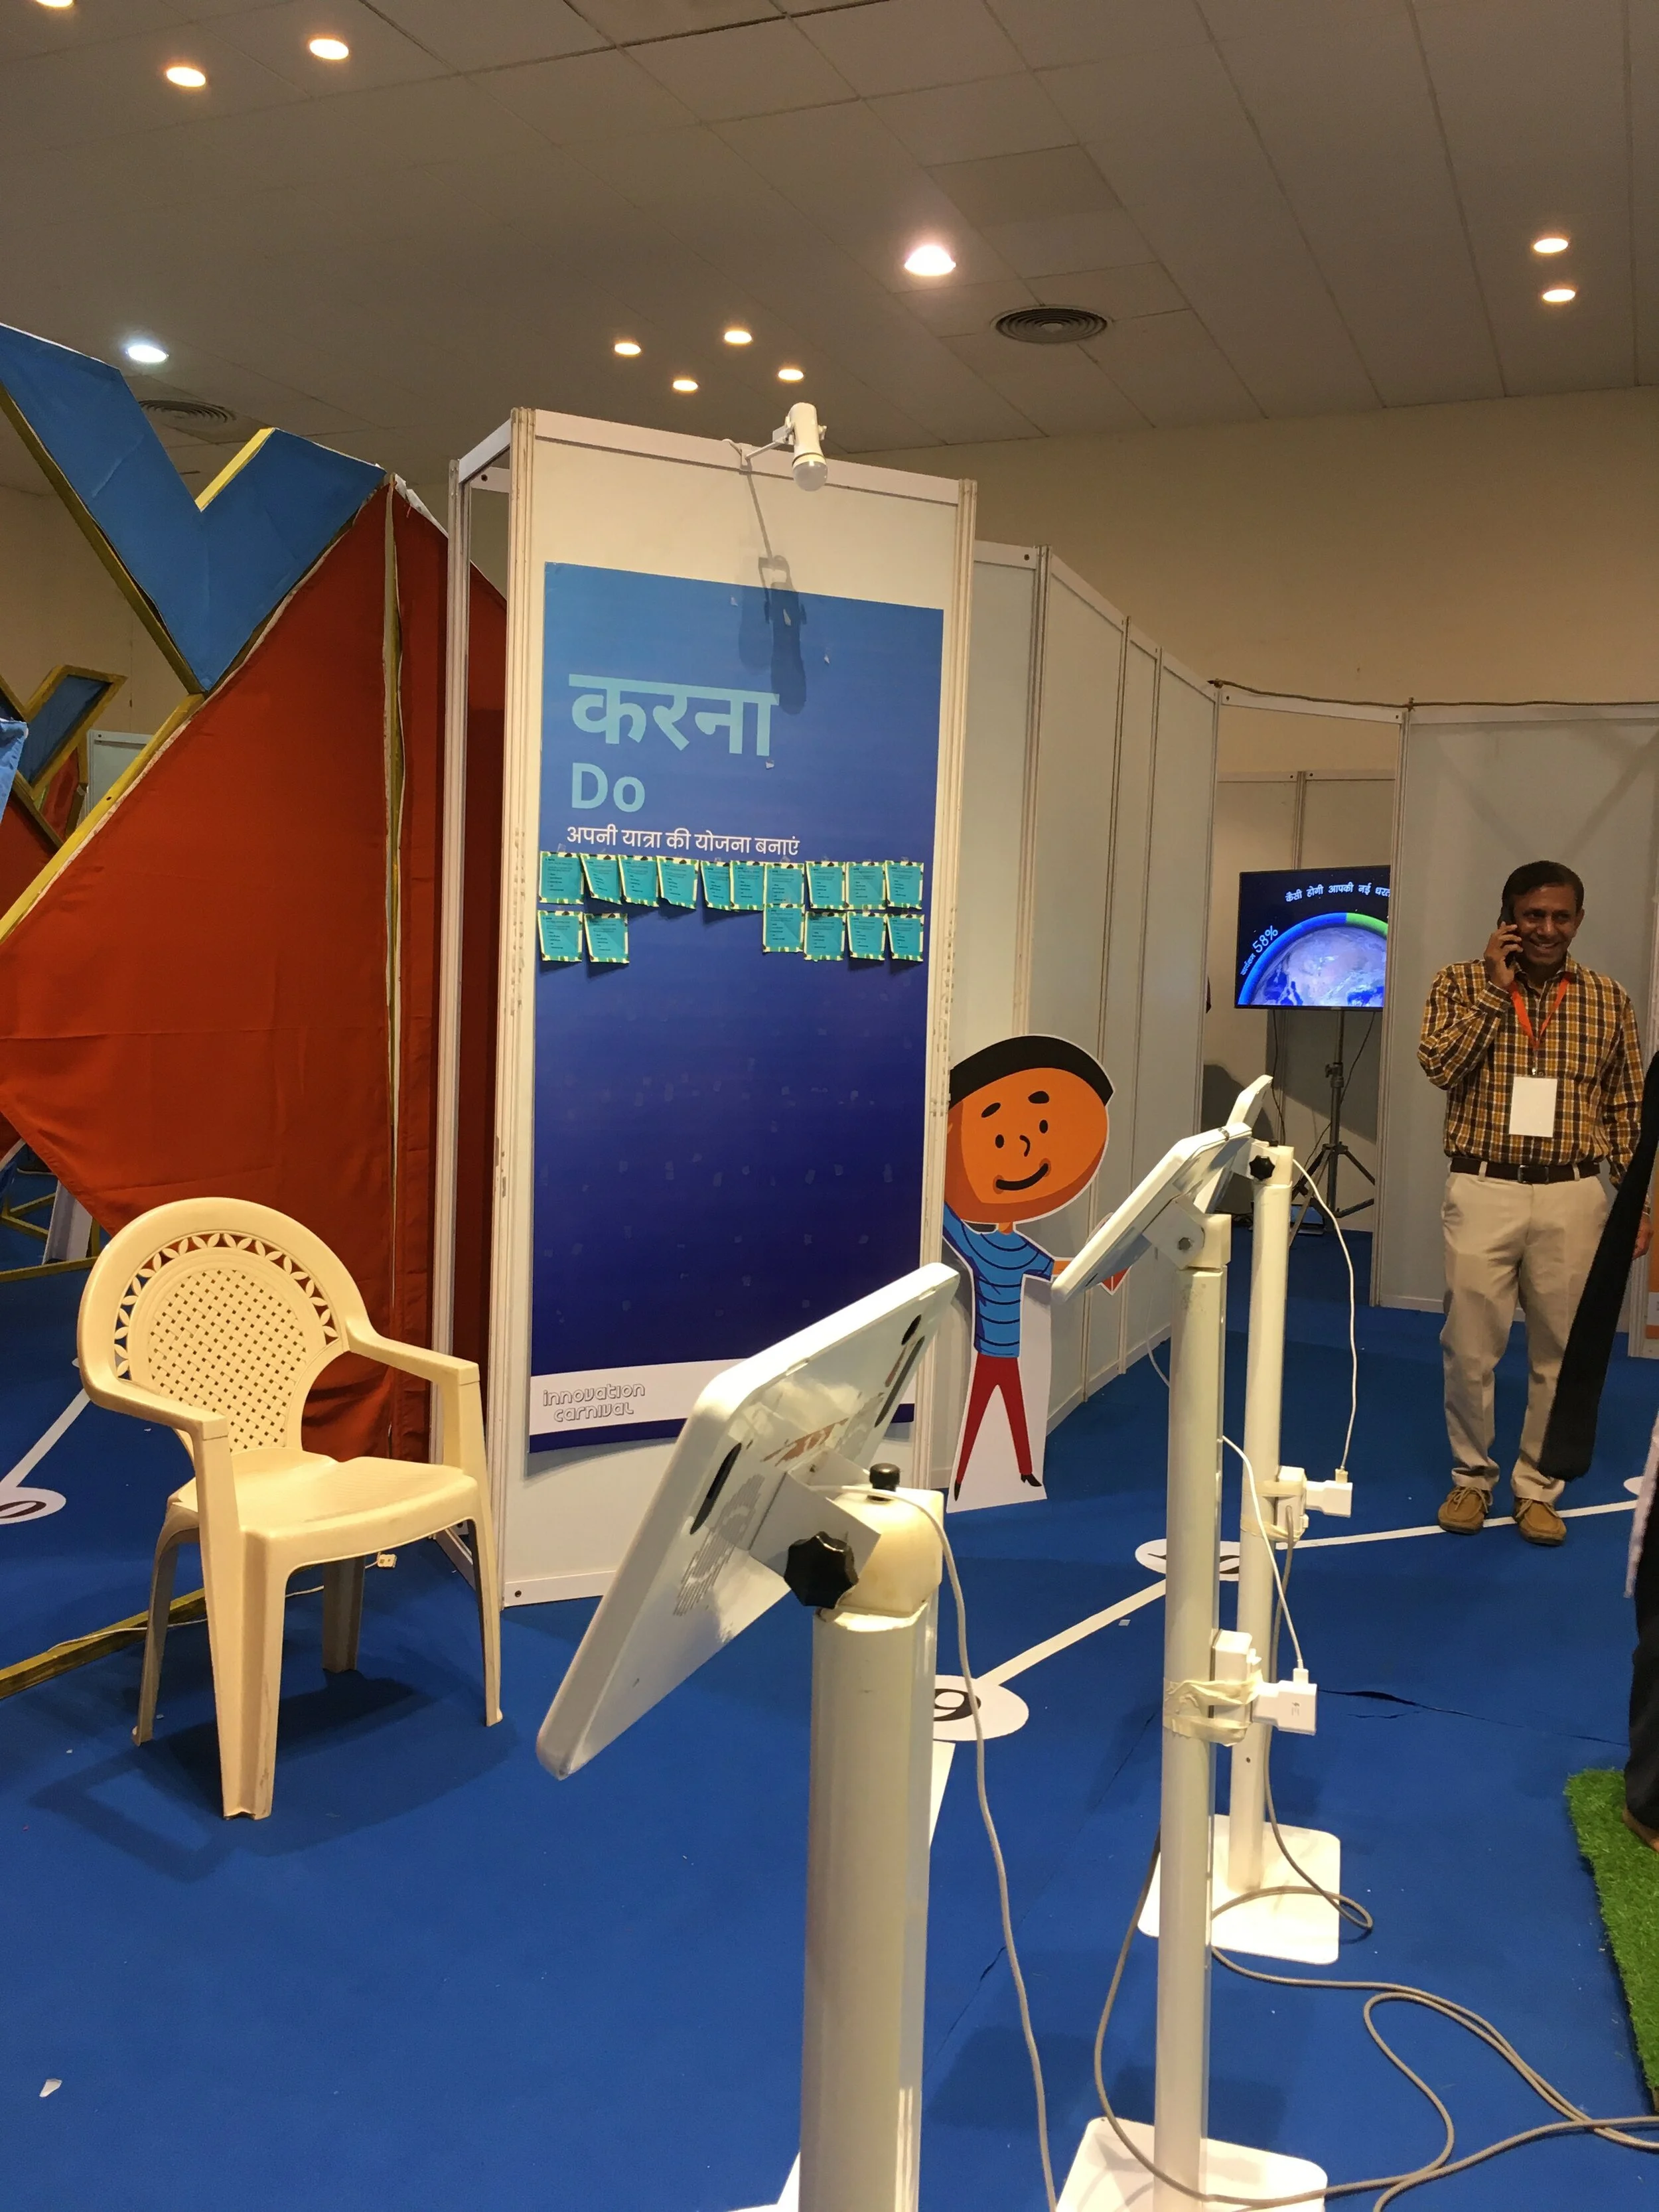
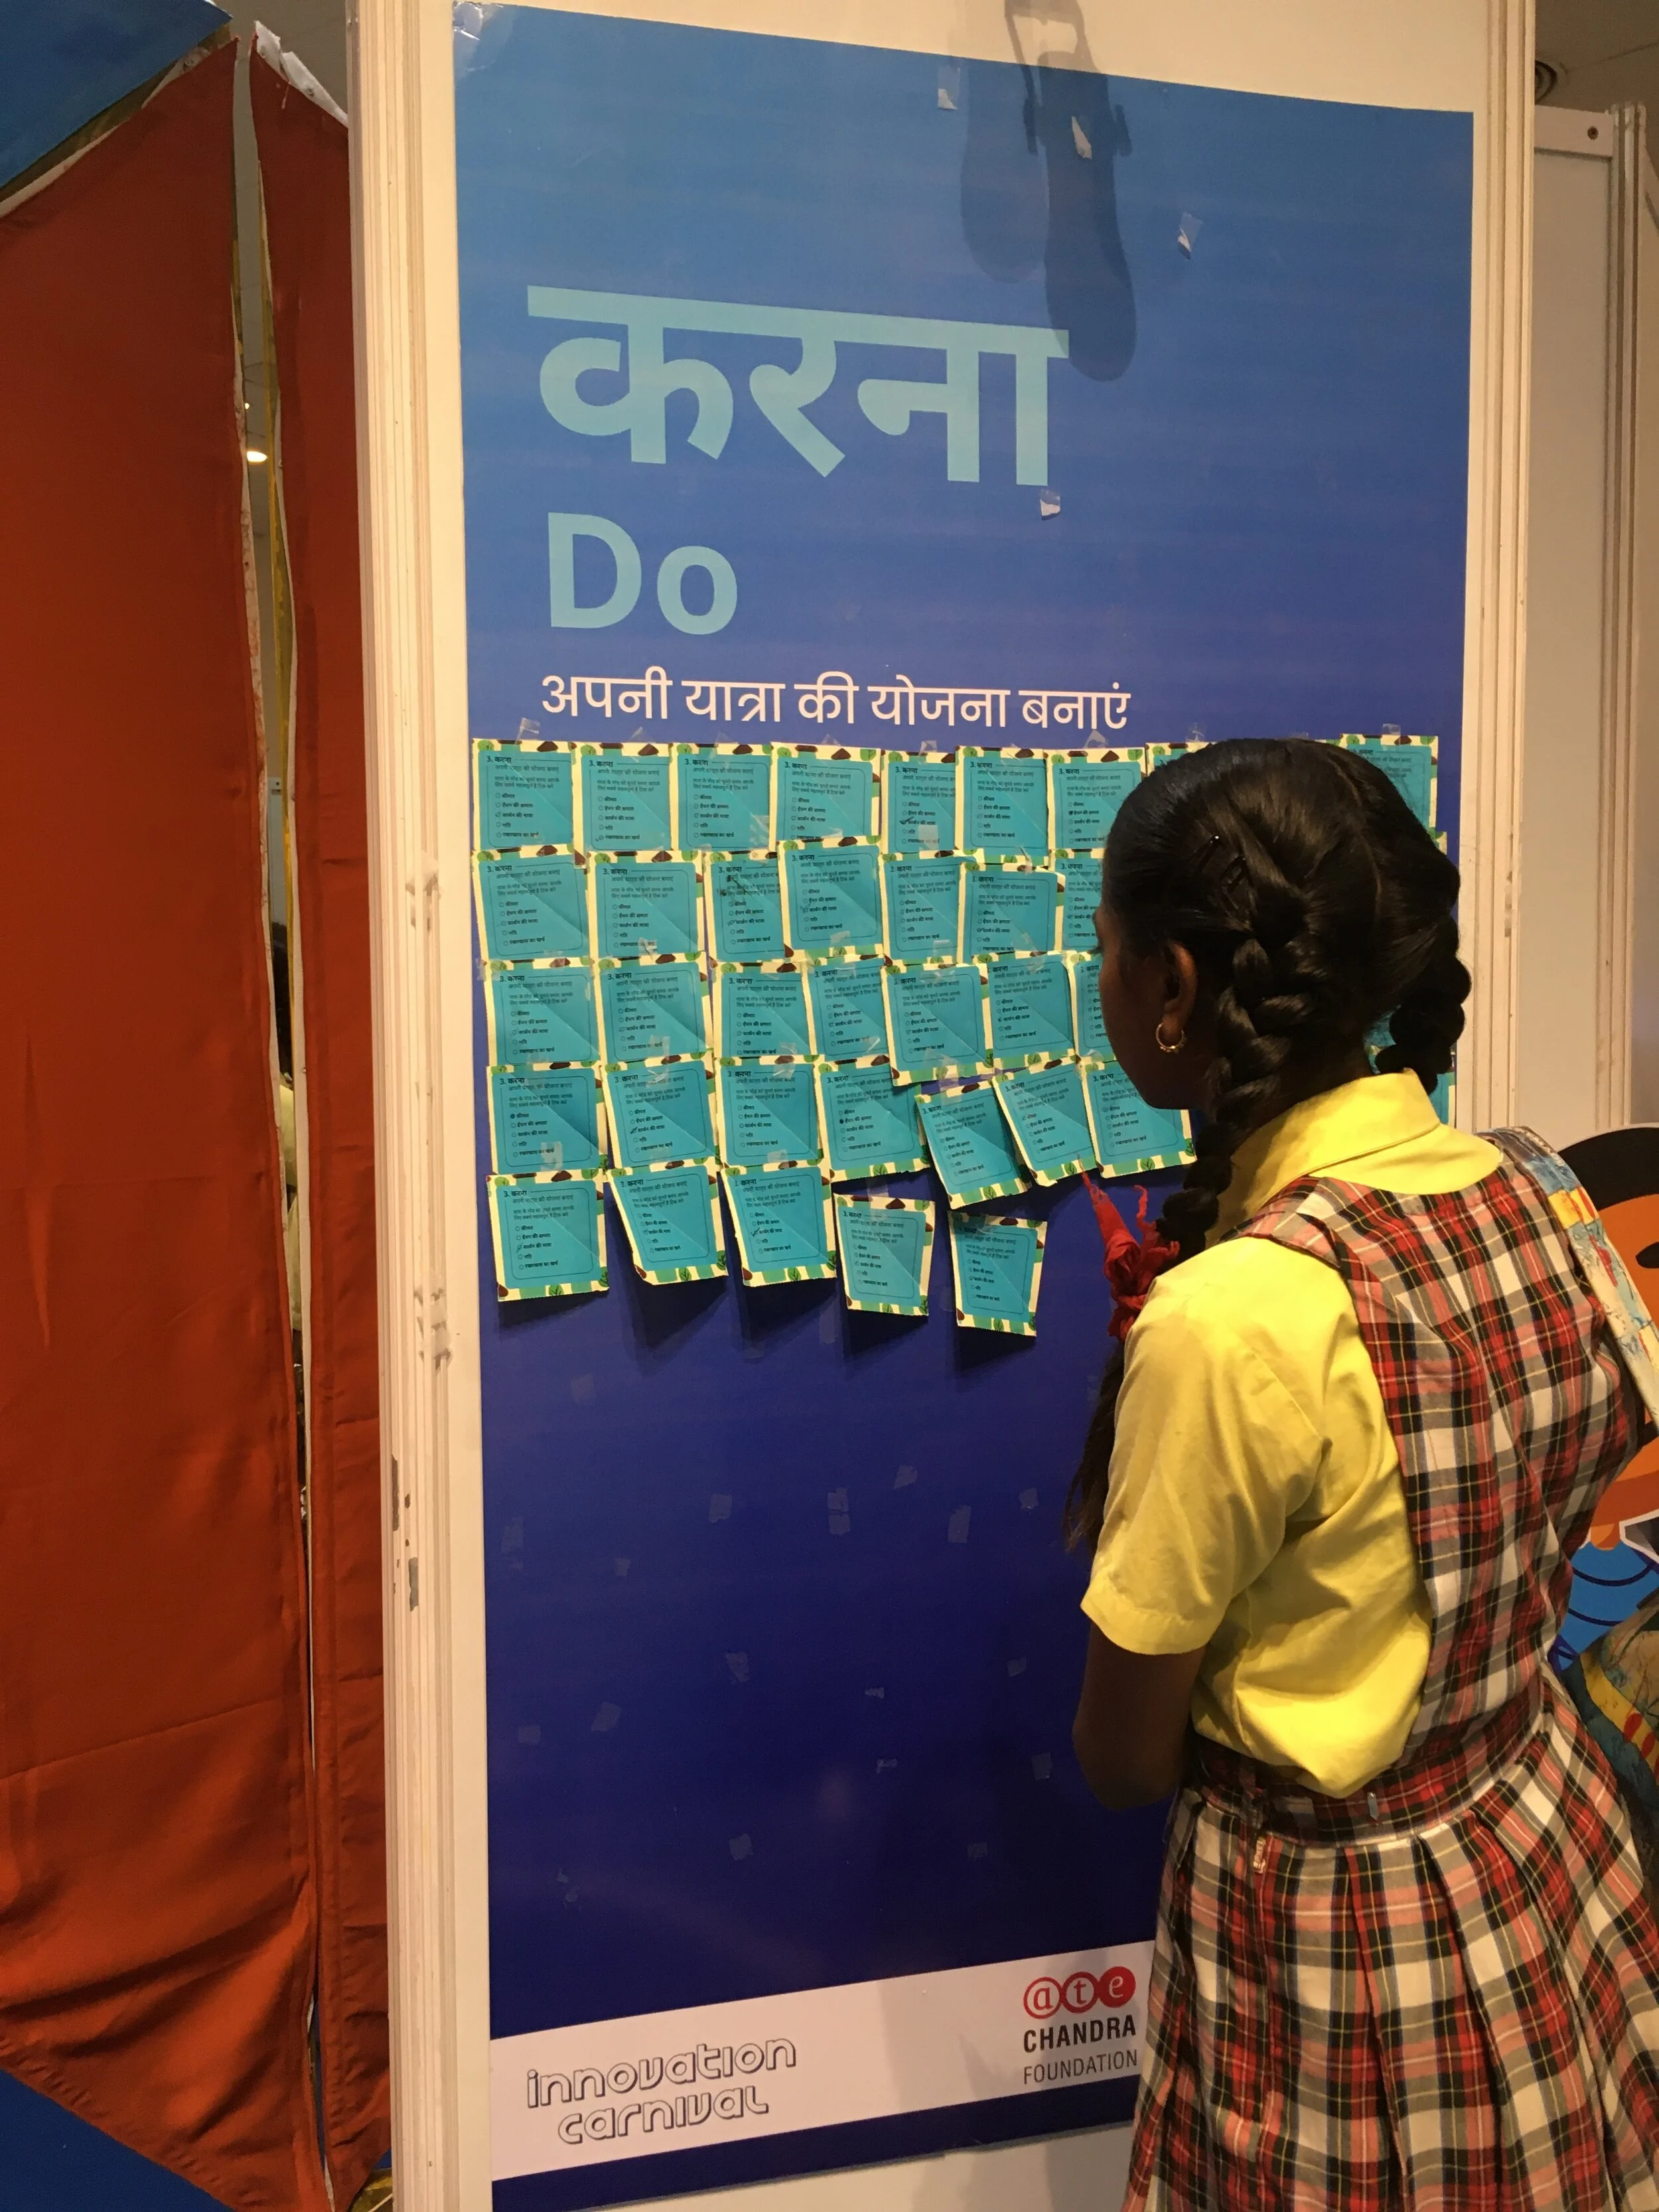
According to this idea, a narrative is weaved into the experience. A protagonist character leads the child through various exhibits in a narrative. The character typically faces a dilemma at each exhibit and presents the child with an activity to complete - either a doodle or a puzzle or a fill in the blank etc. I started formulating specific activities for each of these exhibits.
IDEA 3.0
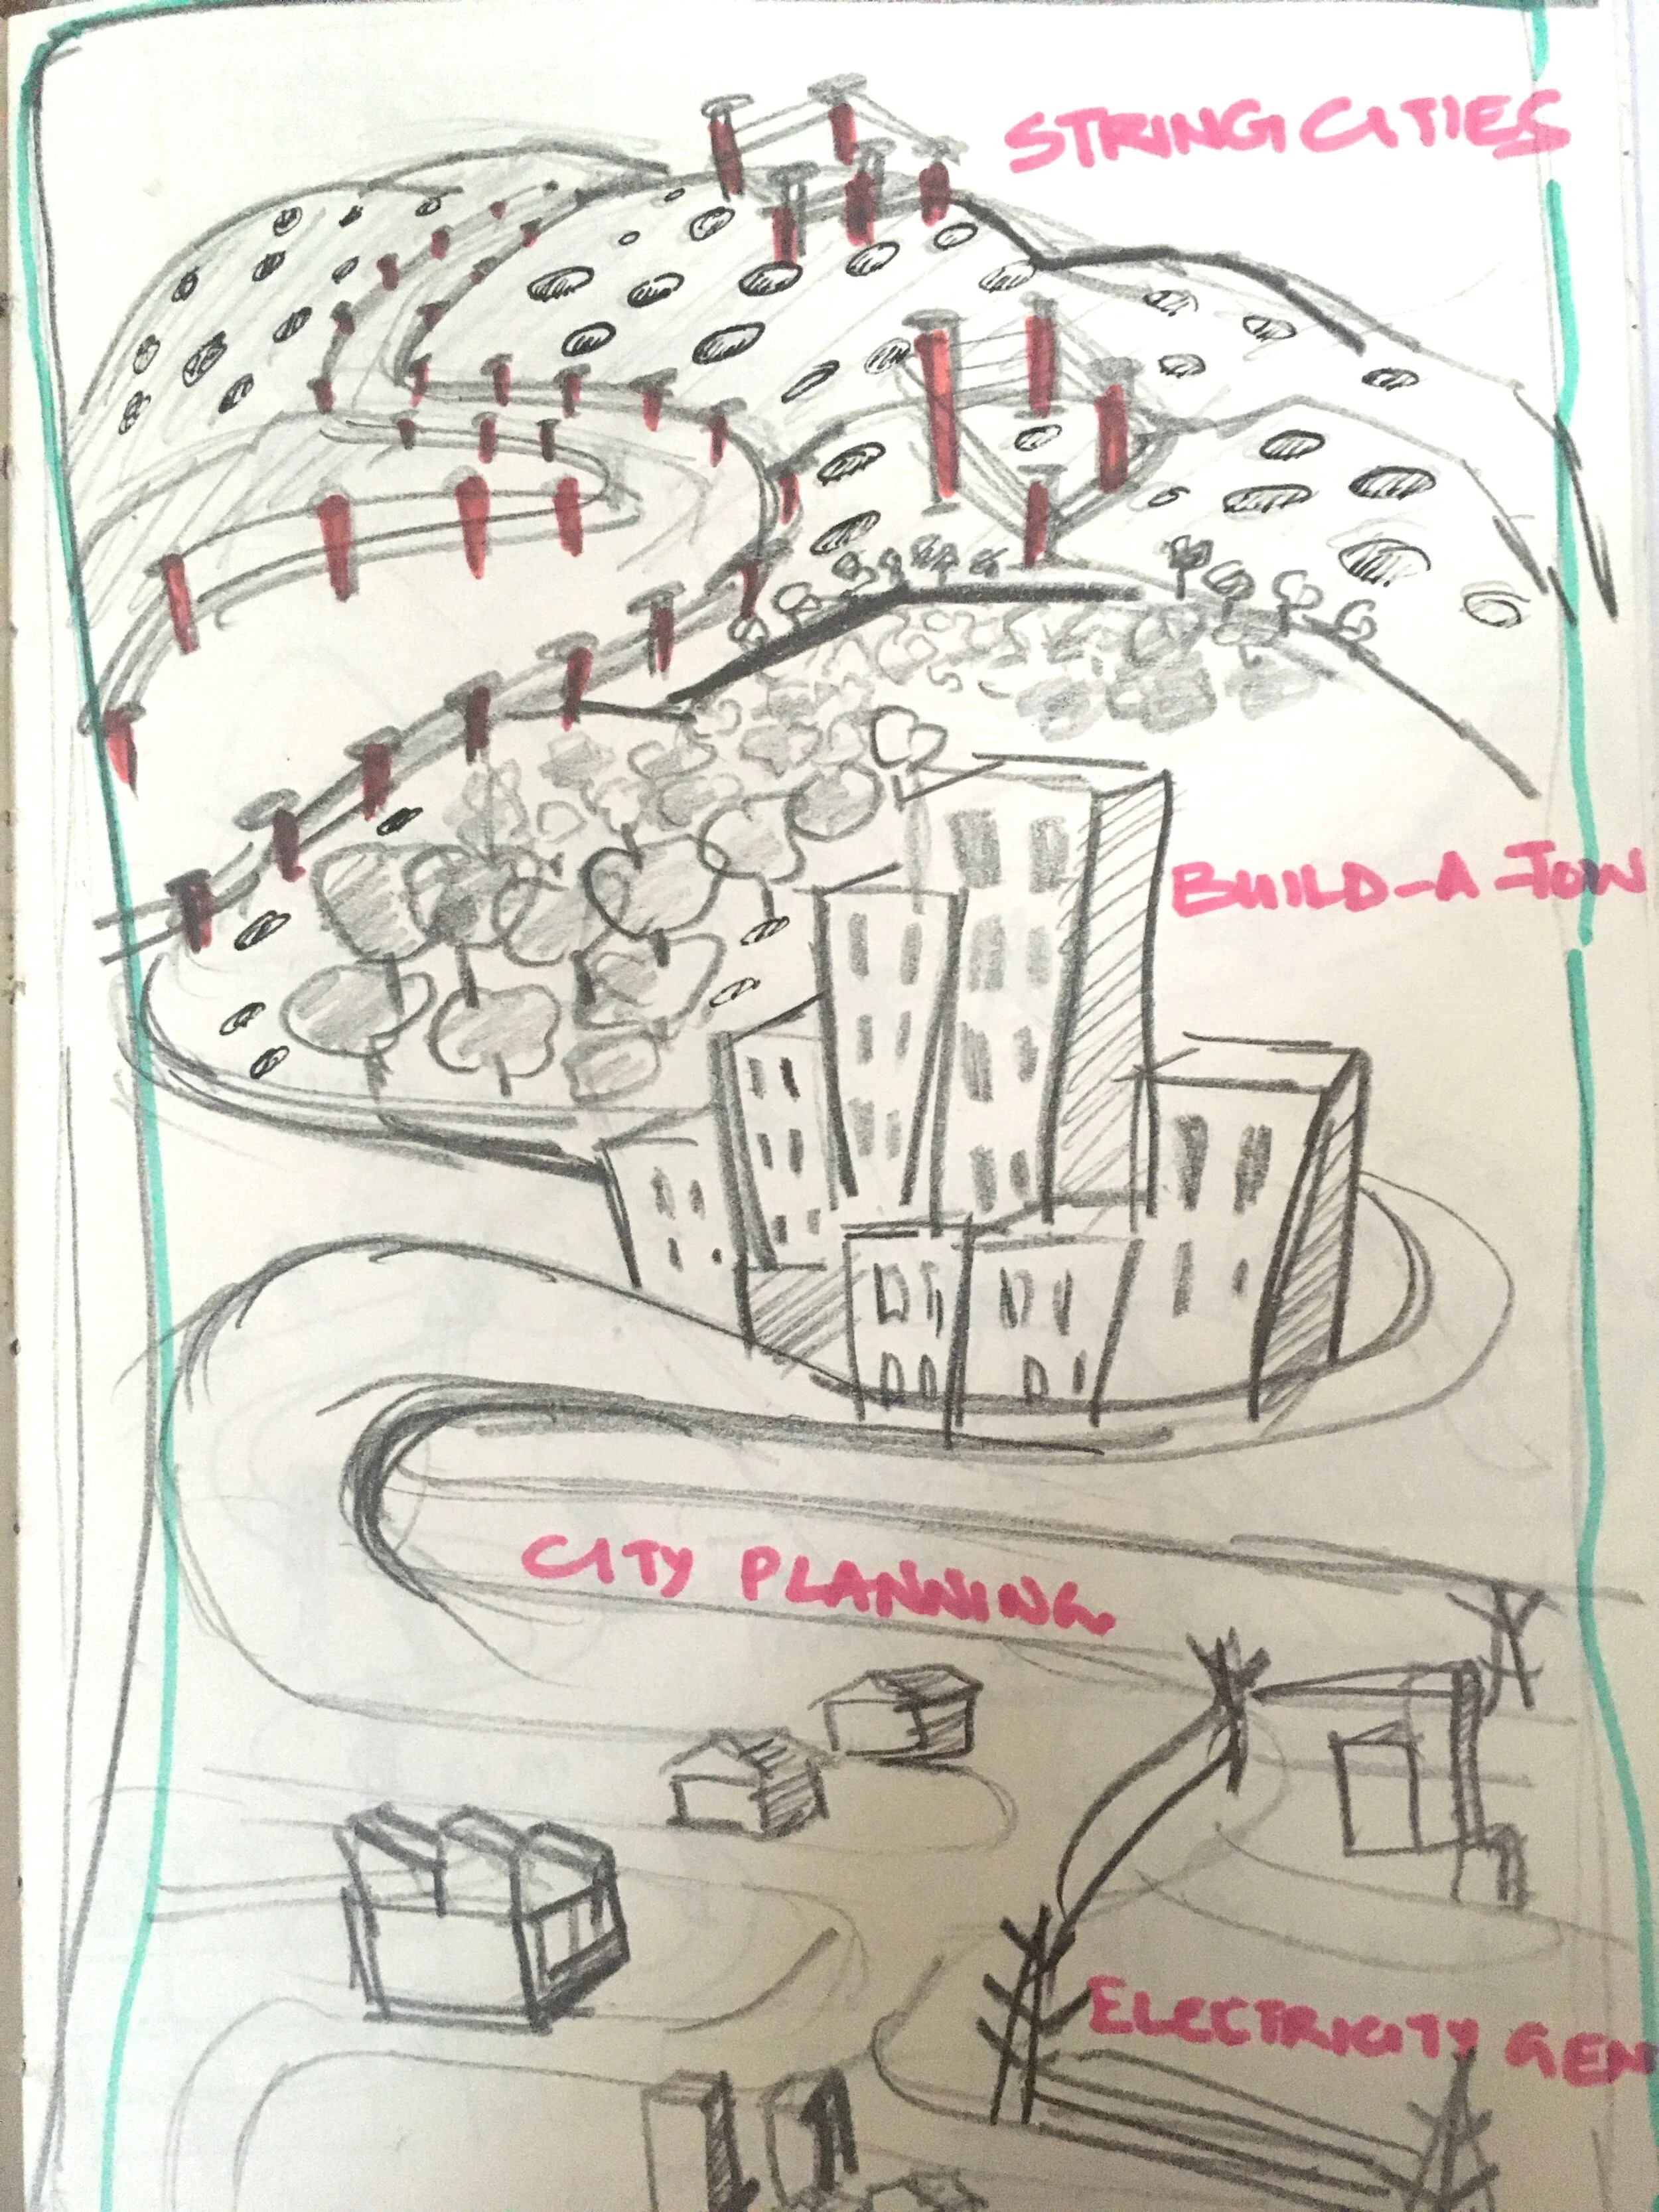
Building on the above idea, I decided to create a full page continuous illustration containing representations of all the exhibits. The idea was to insert the protagonist character across different parts of this illustration and have speech bubbles explaining the activity that the kids needs to do. This was intended to be a full page comic book illustration. I started exploring illustration layouts and sketches.
Prototype
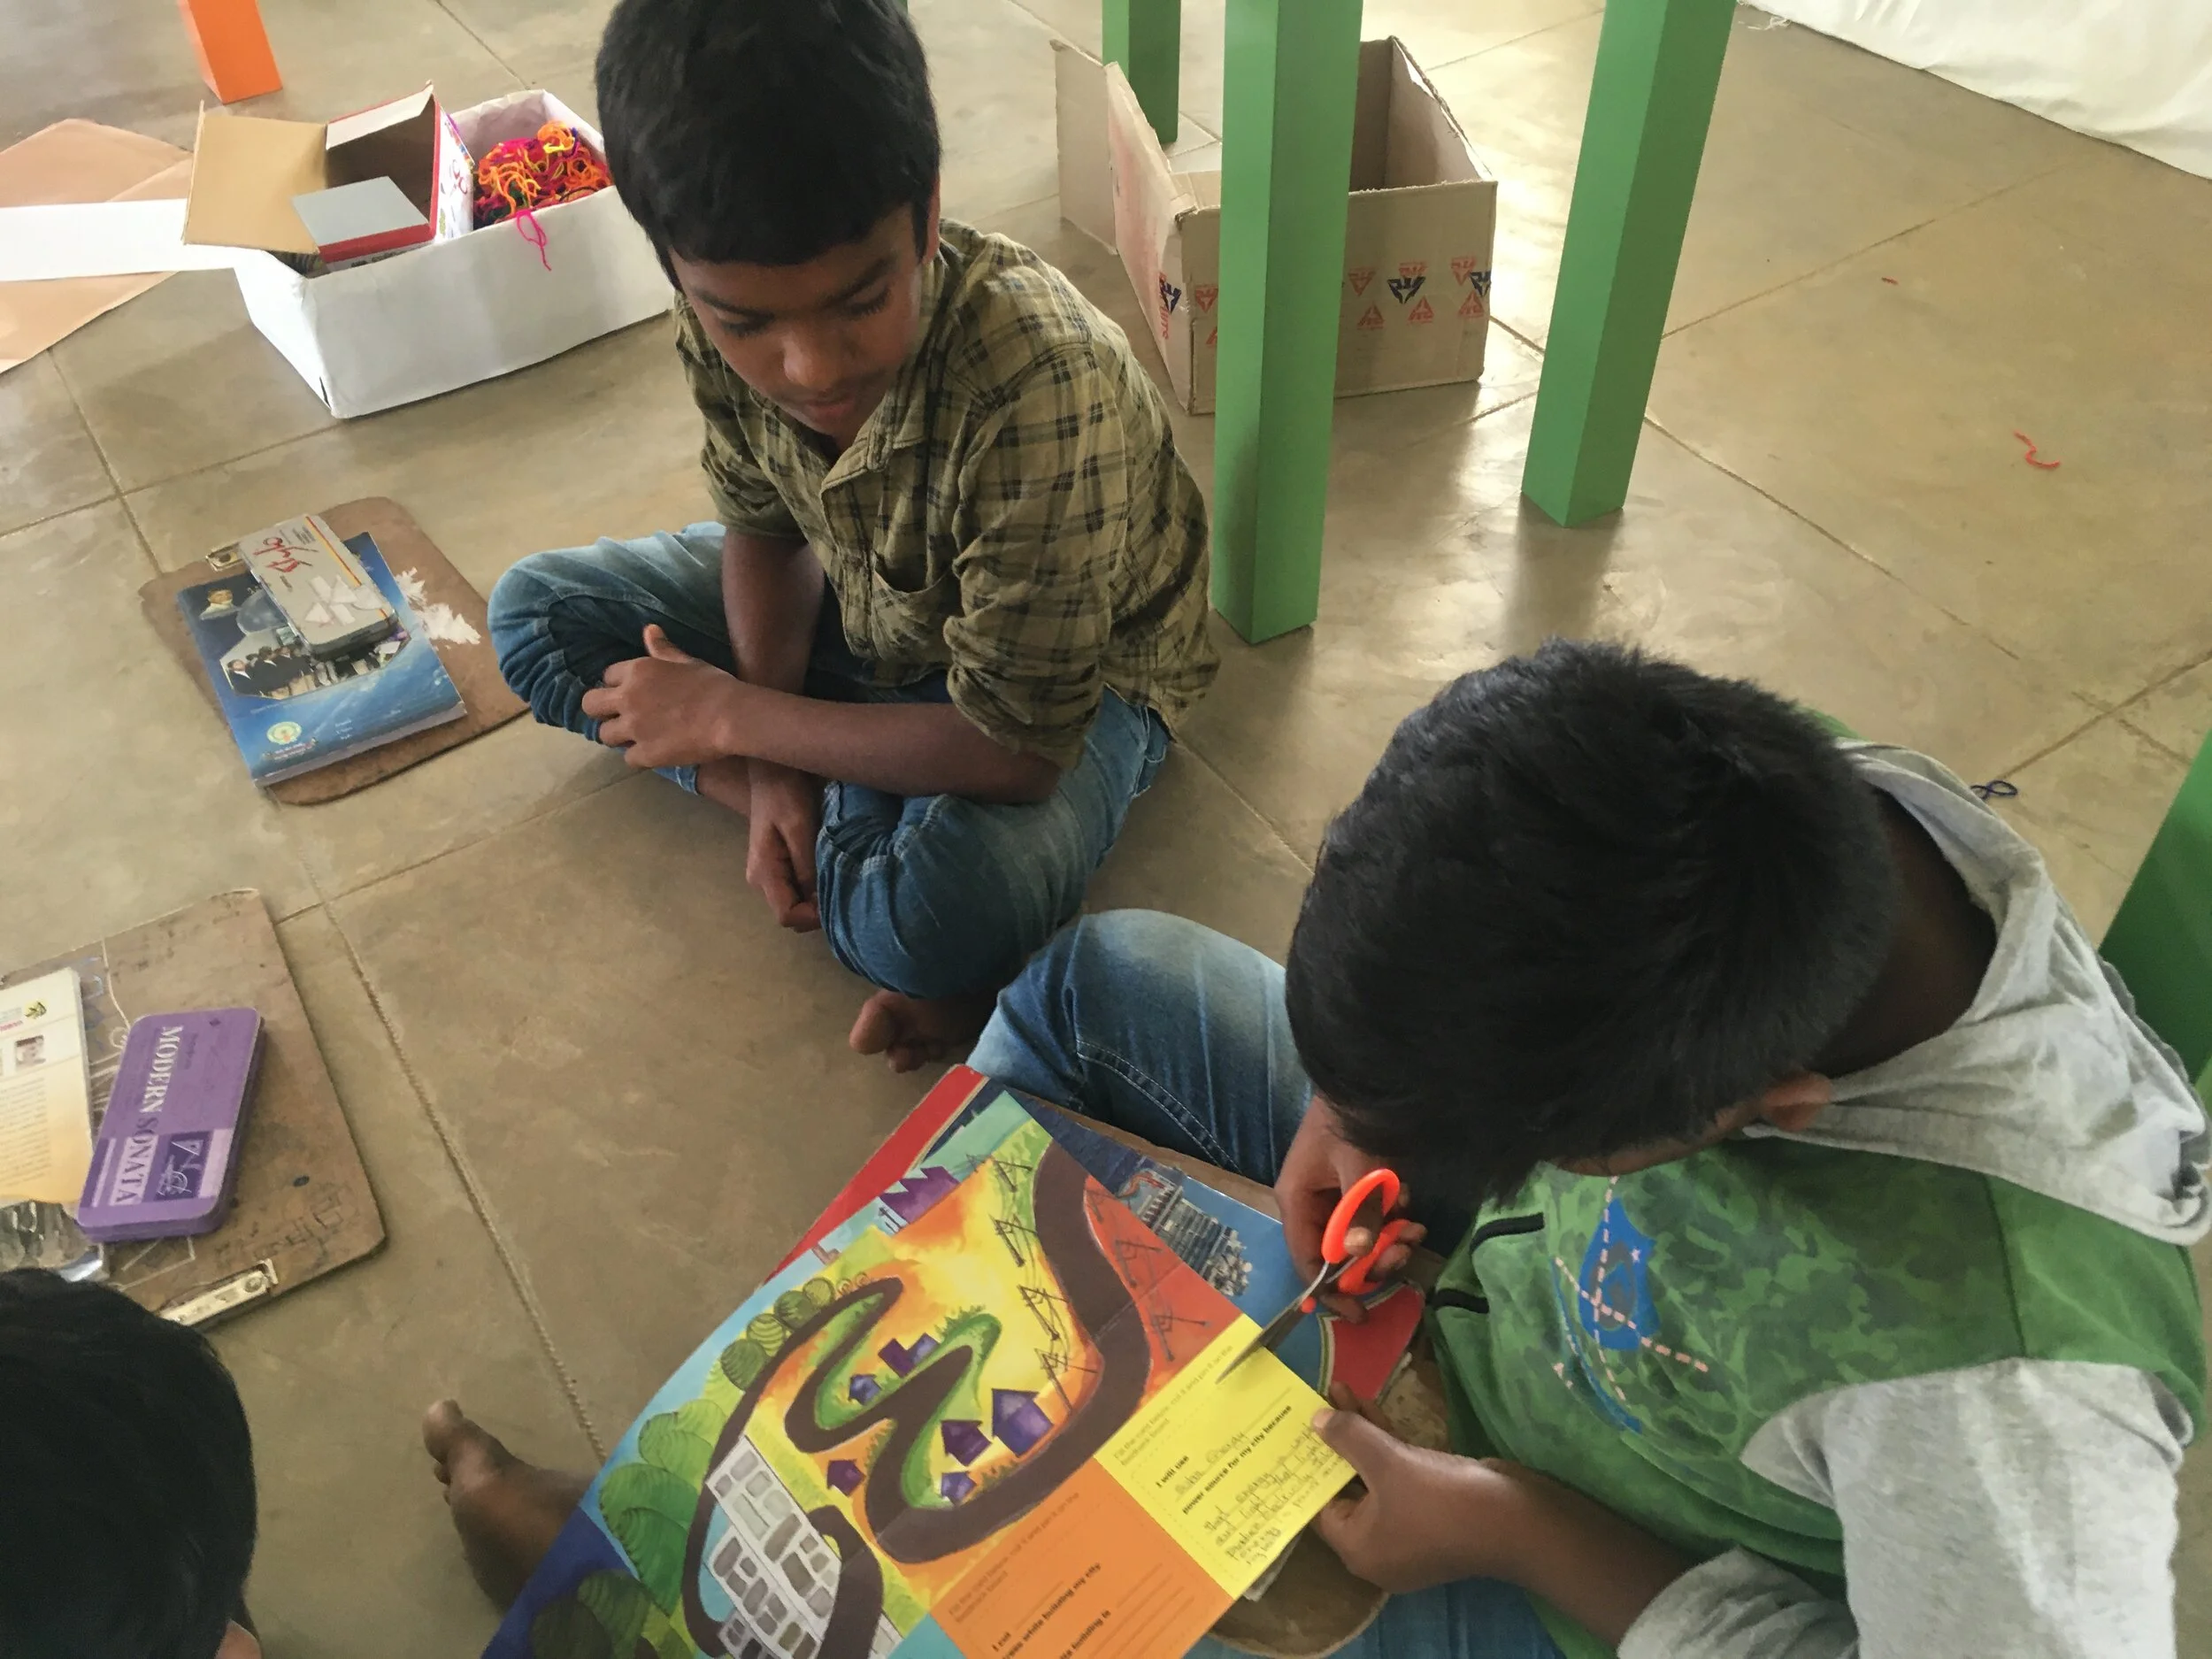
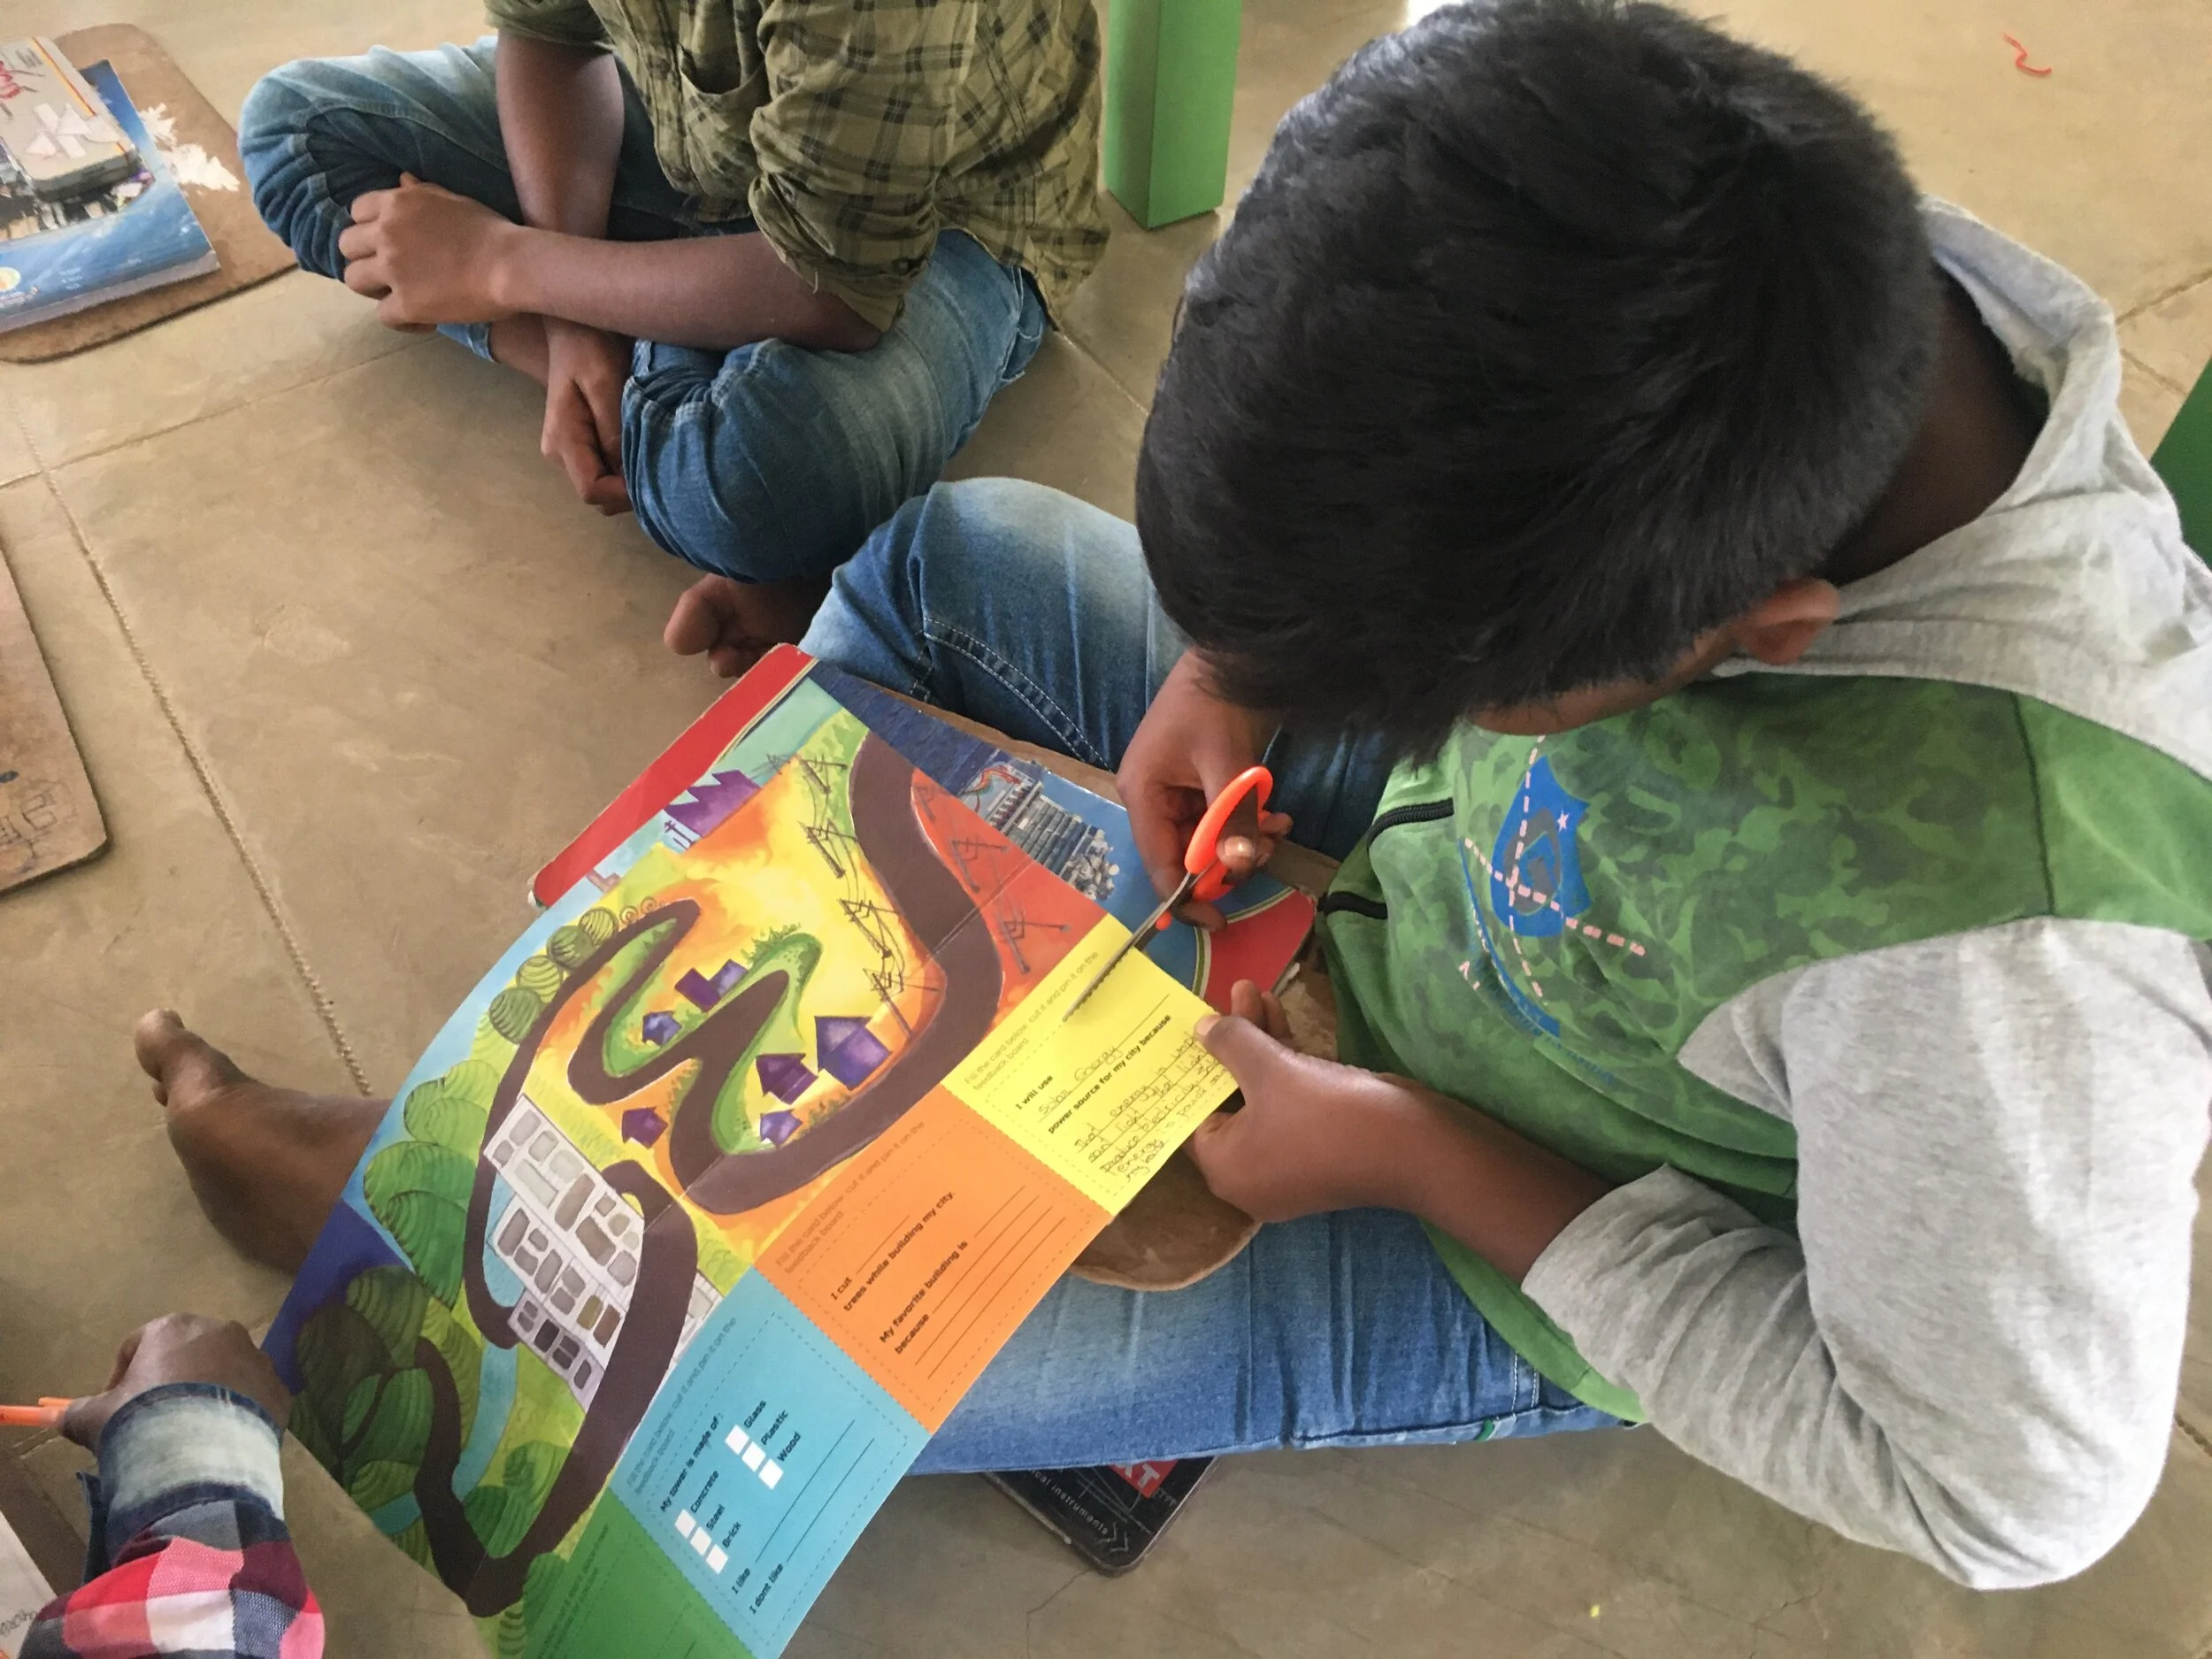
Proceeding with IDEA 3.0, I created a prototype of a folding map that is divided into four segments, one for each exhibit in the housing pathway. It is one continuous illustration featuring activity snippets in the bottom of the map, one for each exhibit, placed underneath the corresponding segment. I tested this prototype with two sessions of 7th and 9th standard children in the Agastya Kuppam campus. Following are the observations and the shortcomings of this map.

Front Side.
Back Side.
Shortcomings
The children weren't able to connect various segments of the map to the exhibits. The visual imagery was very different from the hardware of the exhibits in itself. Also, since all the activity cutouts were placed in the bottom, children were left with an unusable illustration piece once they tore out all the activity bits. They weren’t using the top illustration portion for anything.
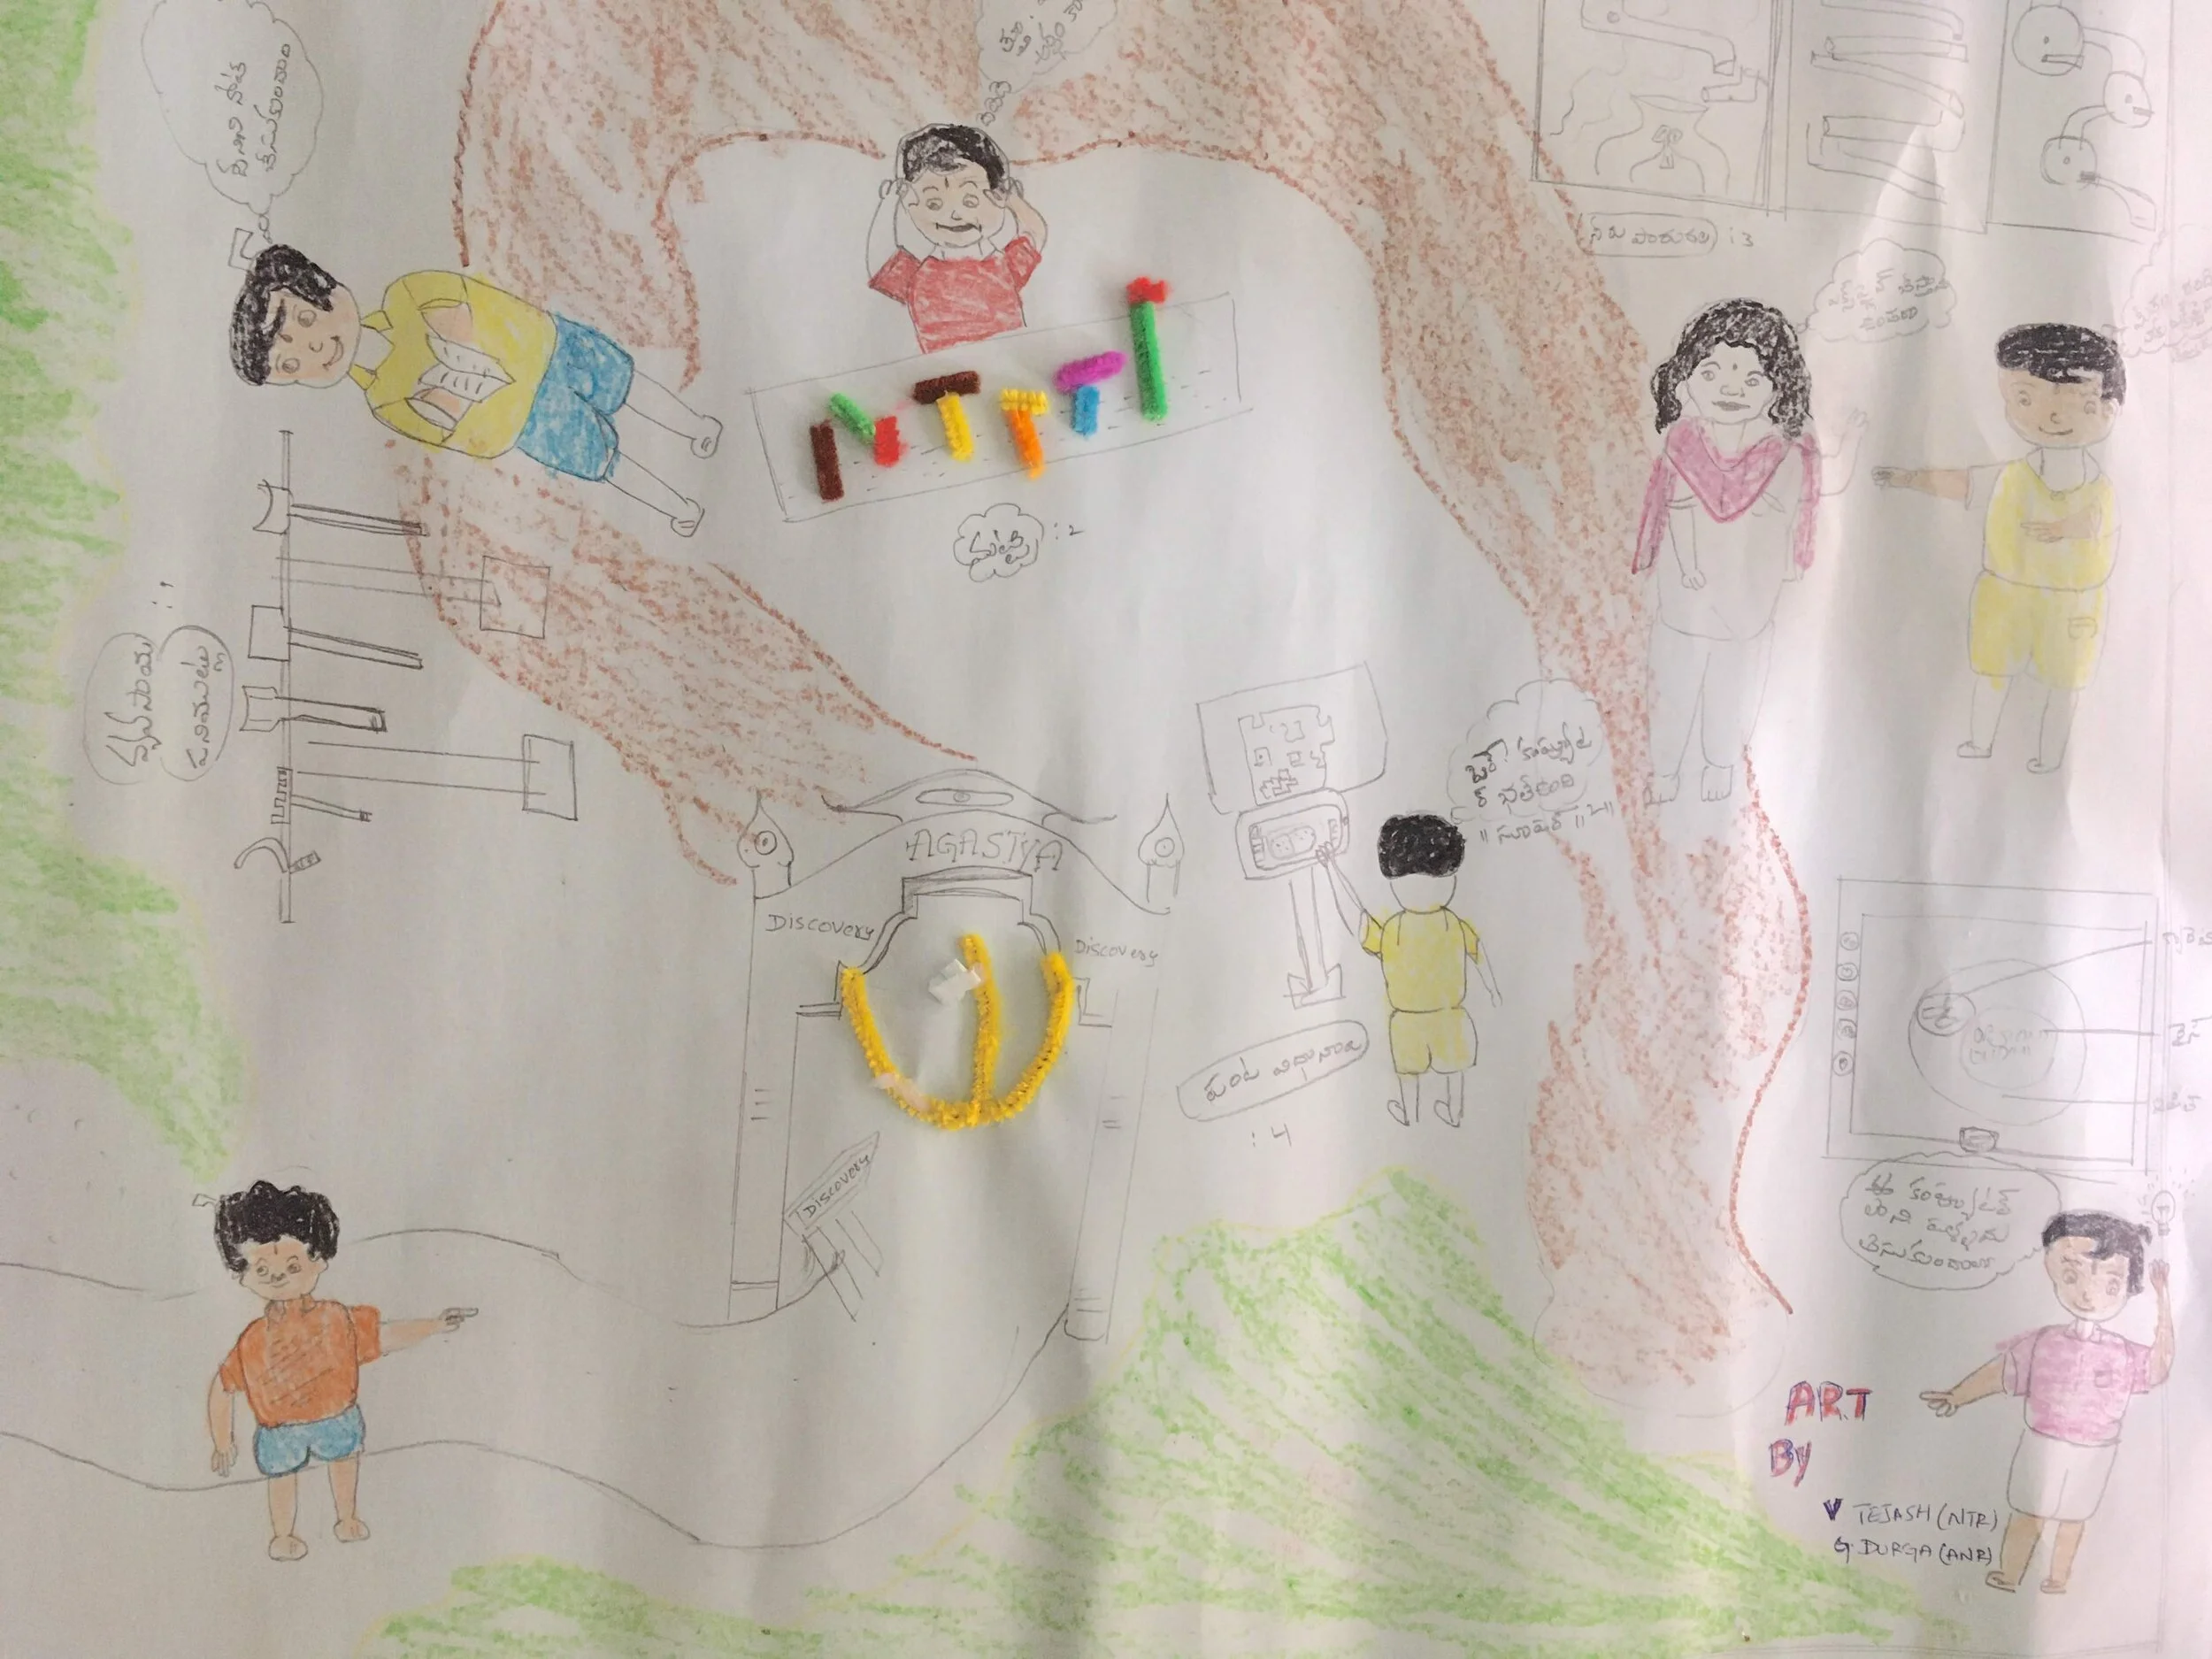
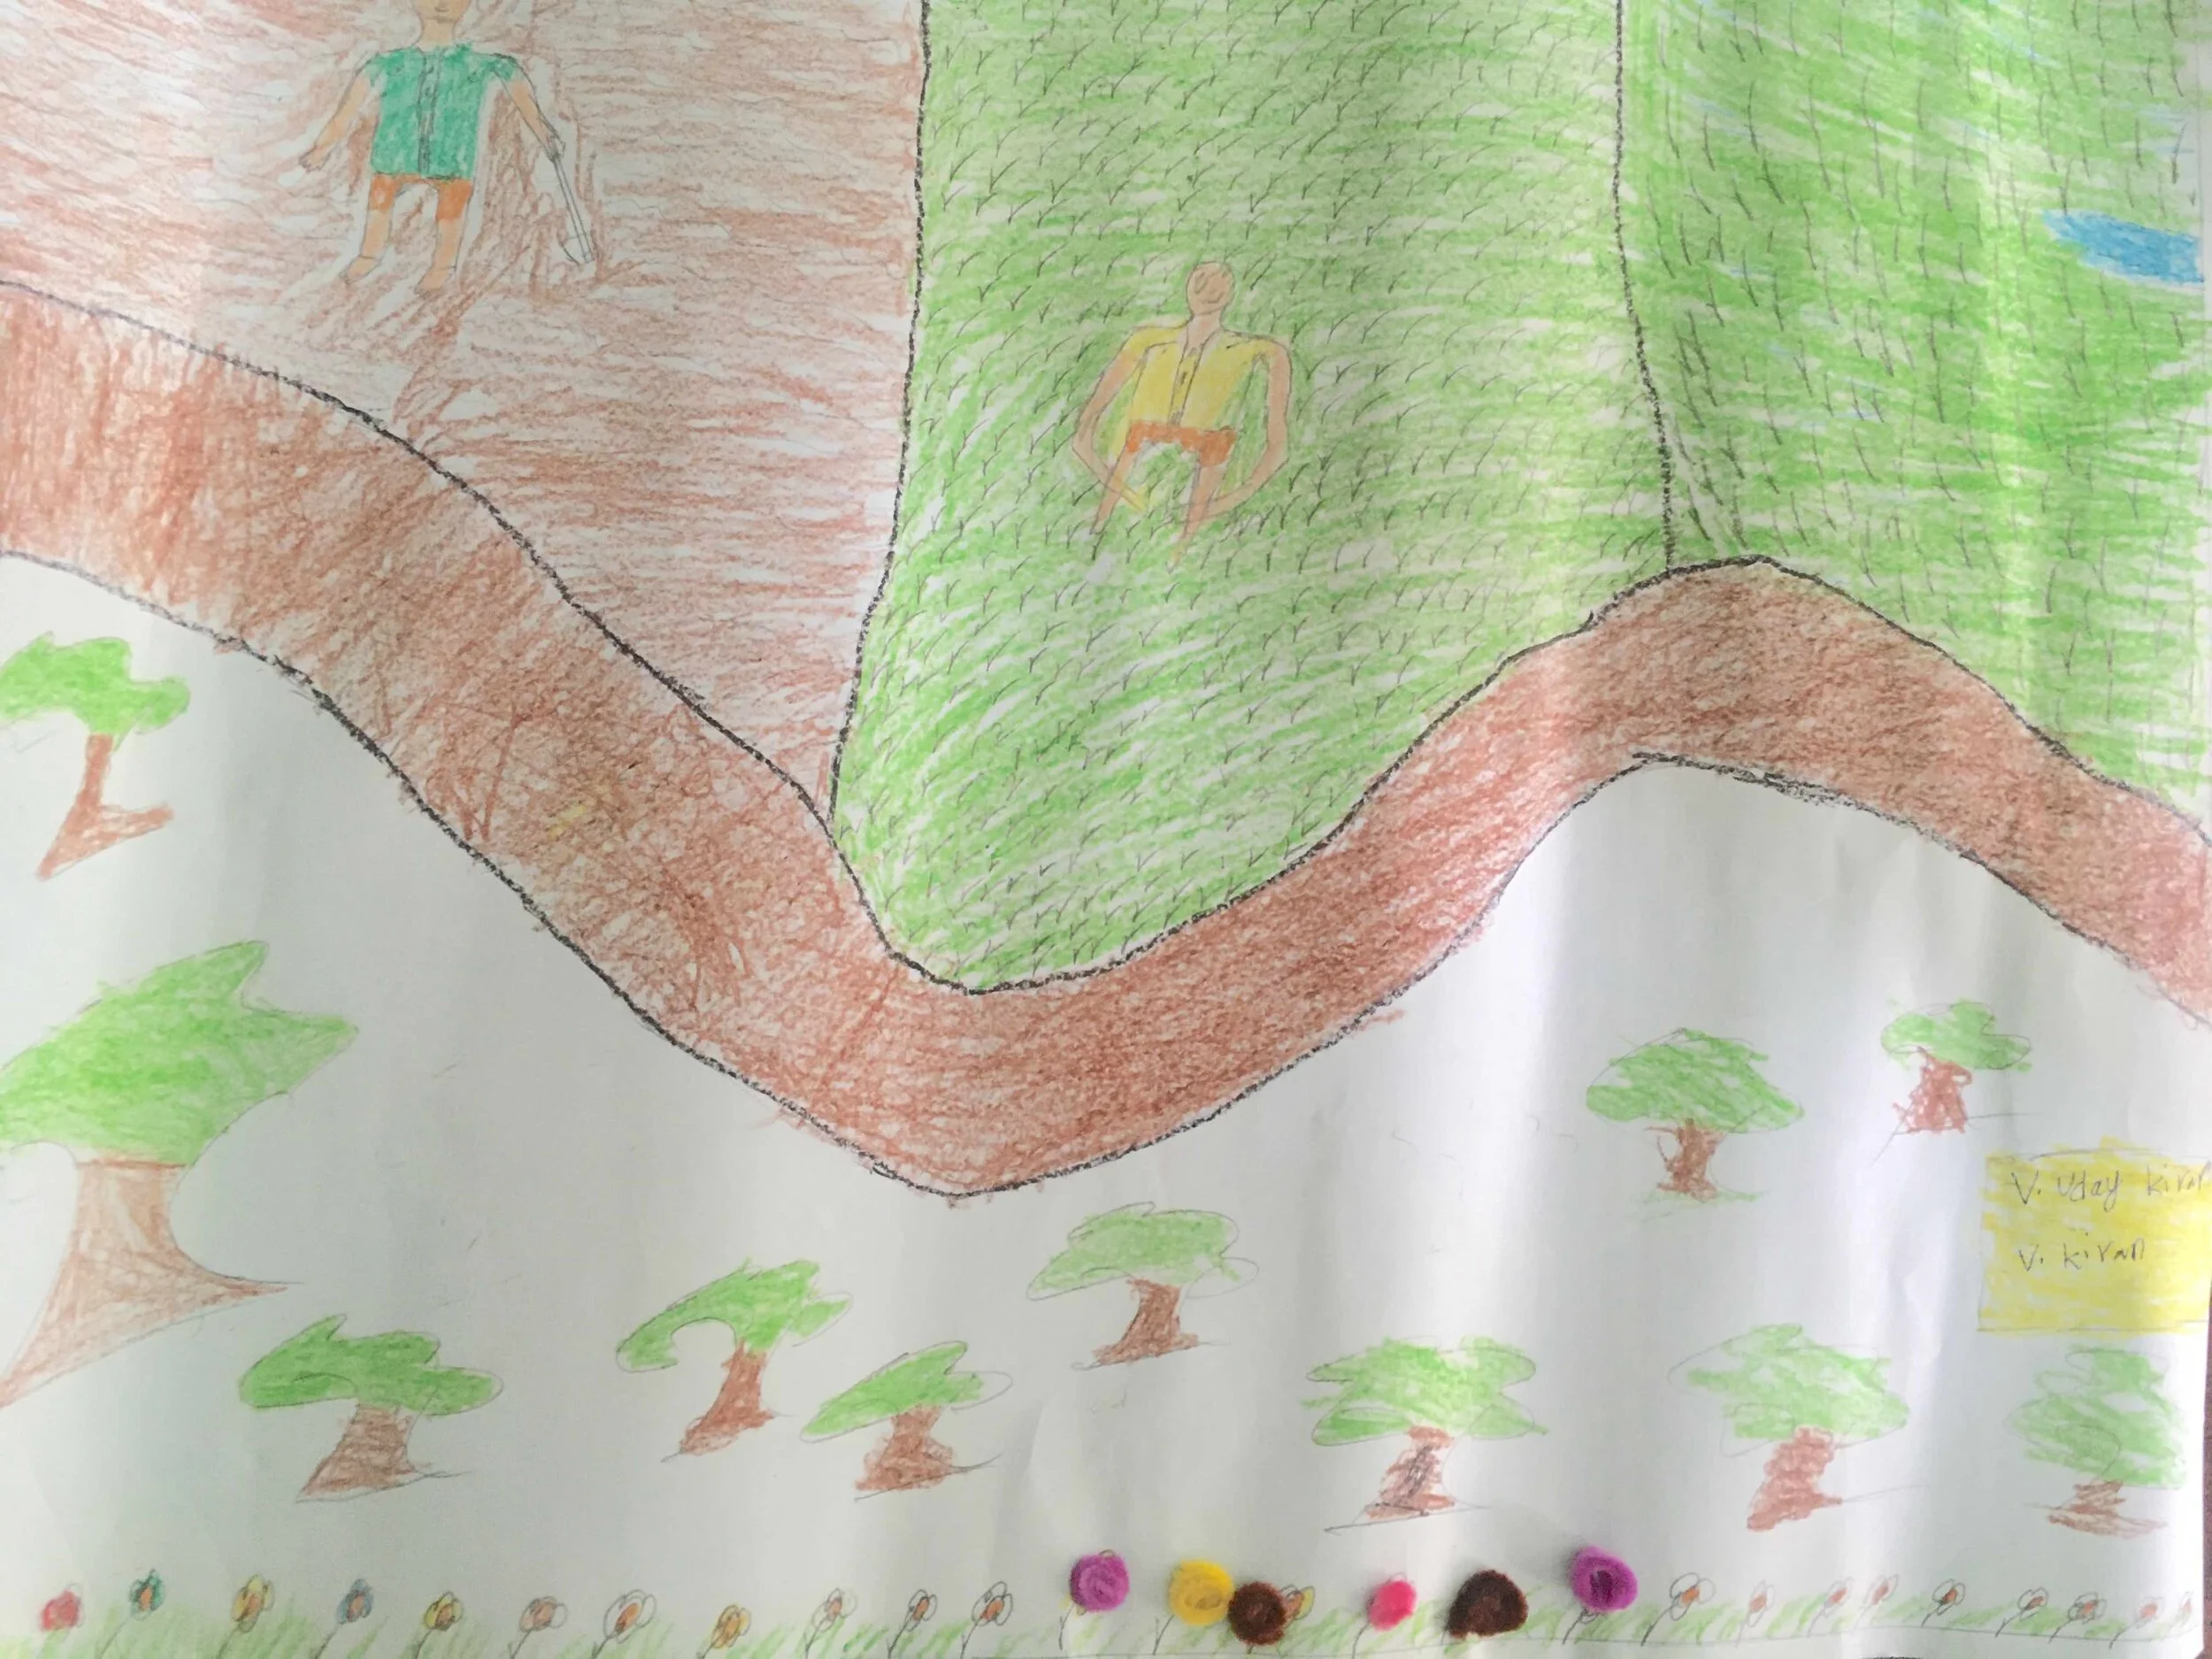
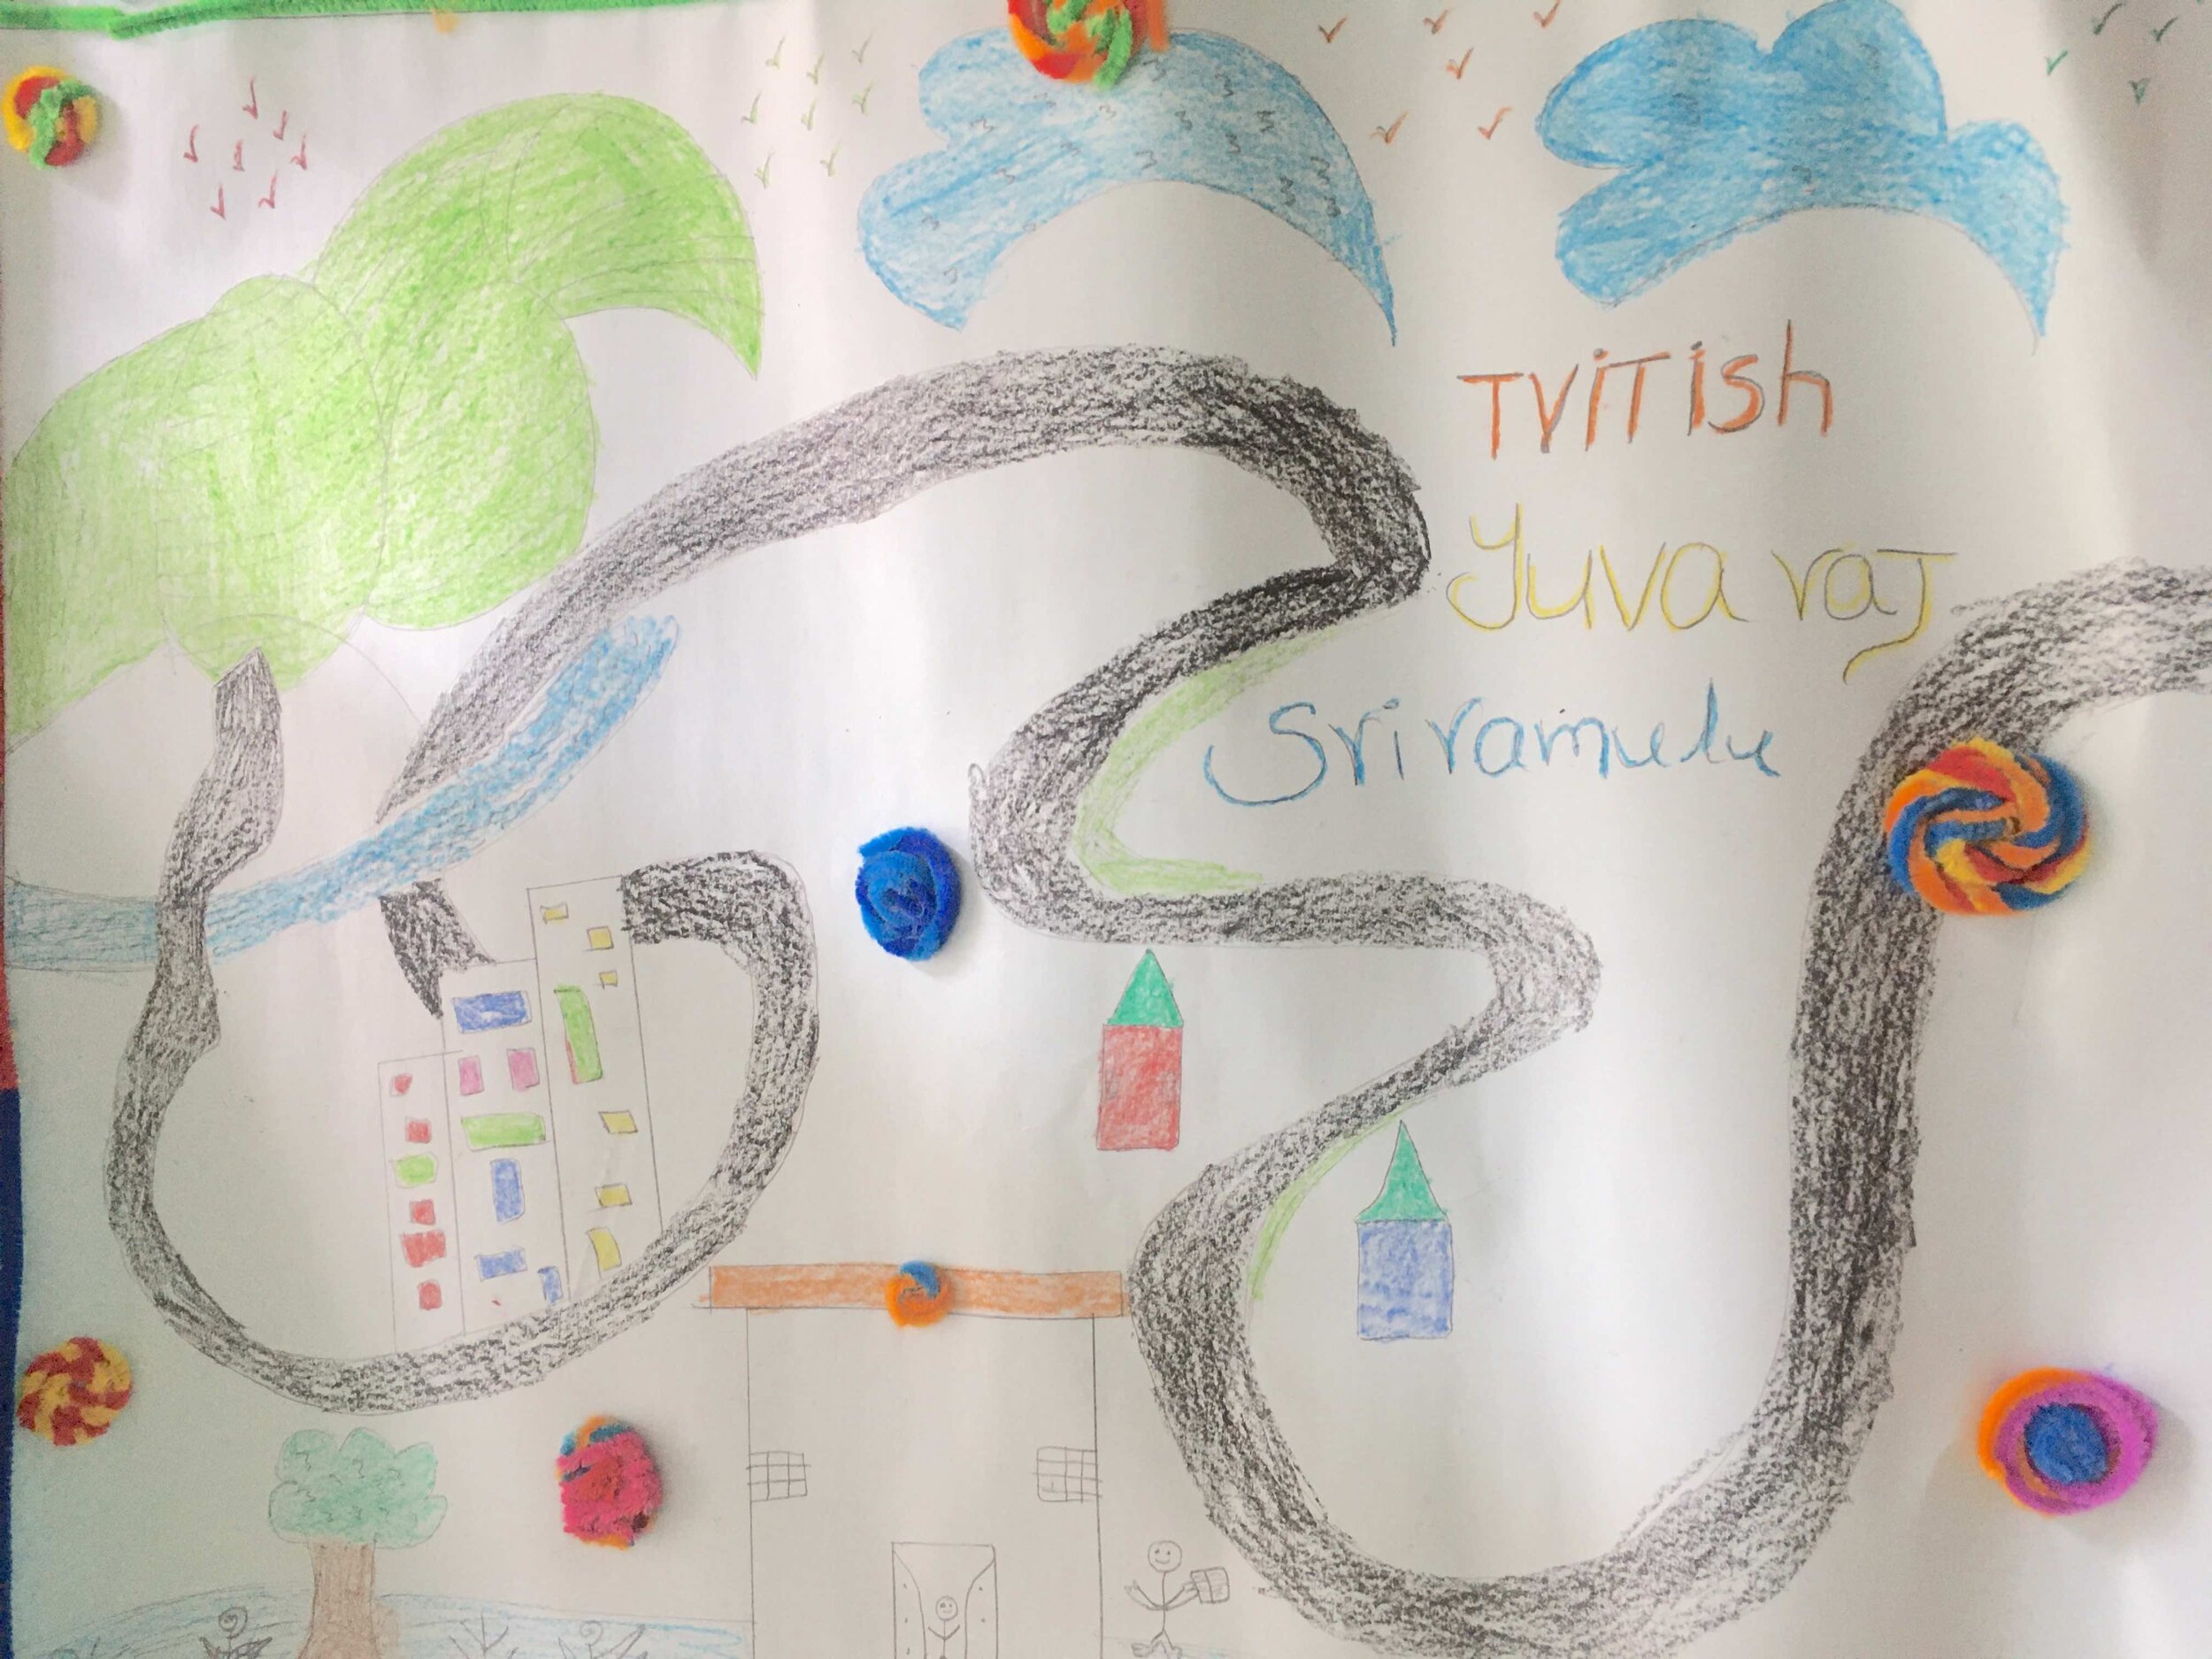
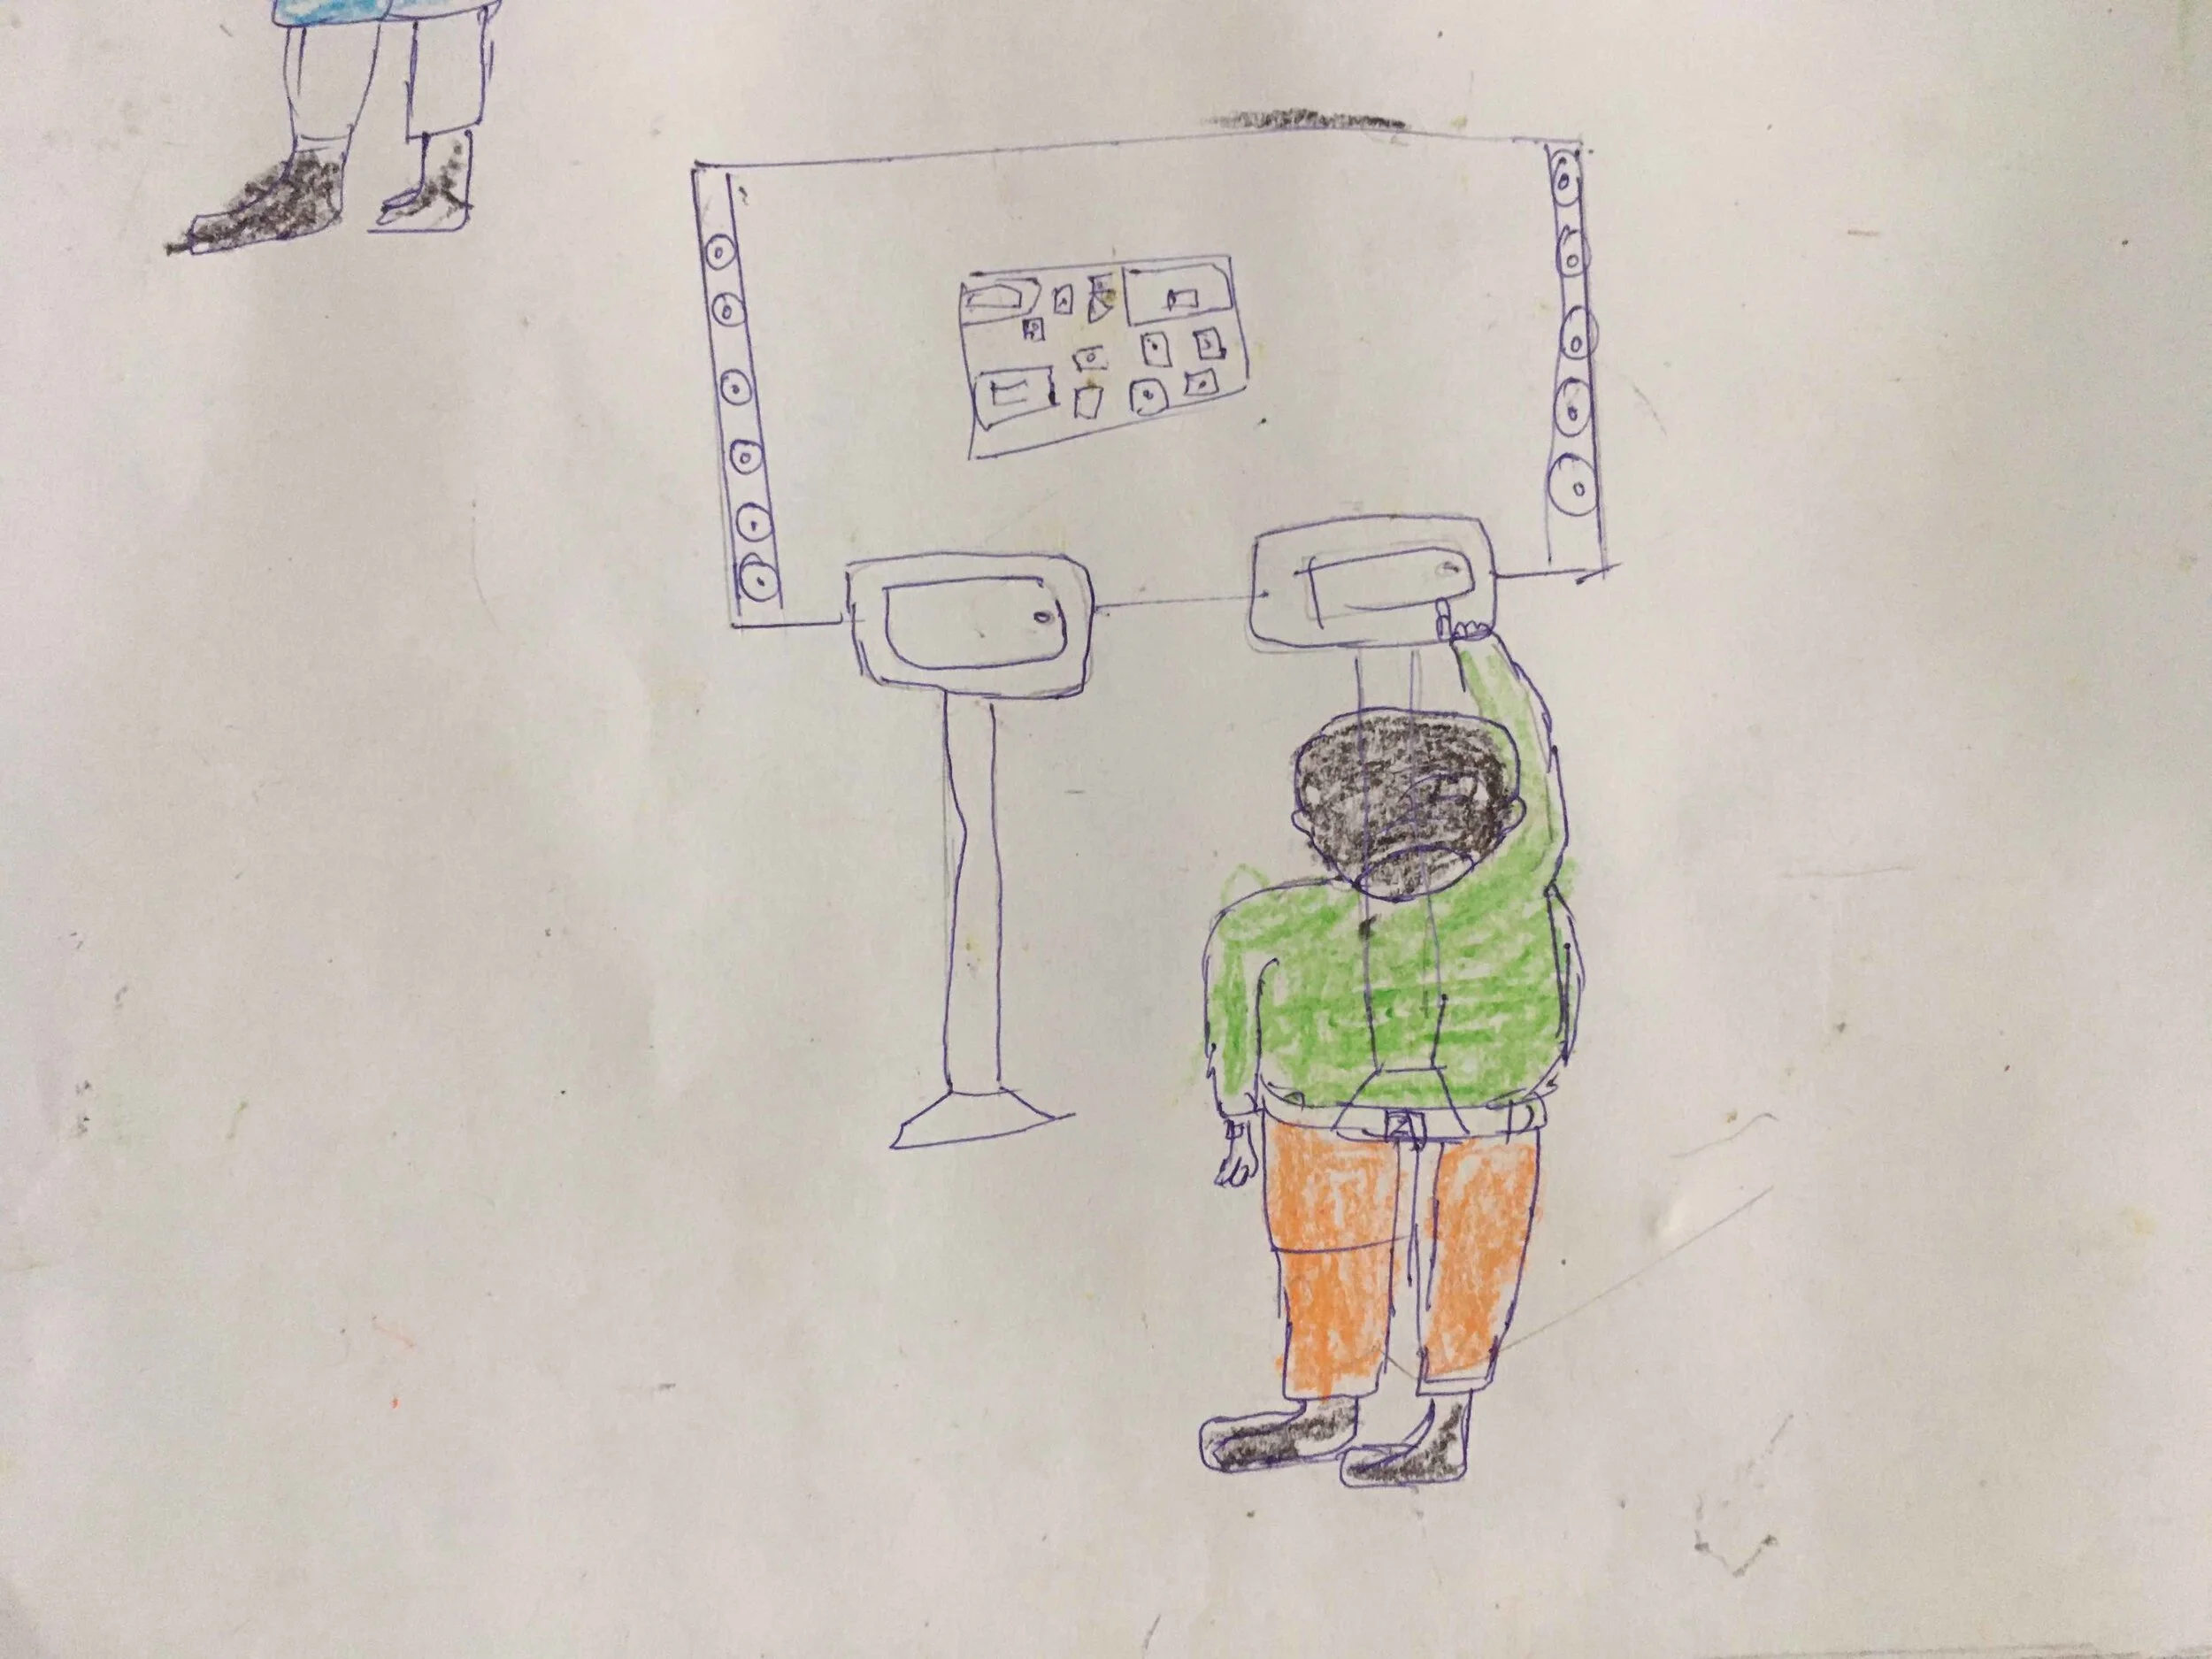
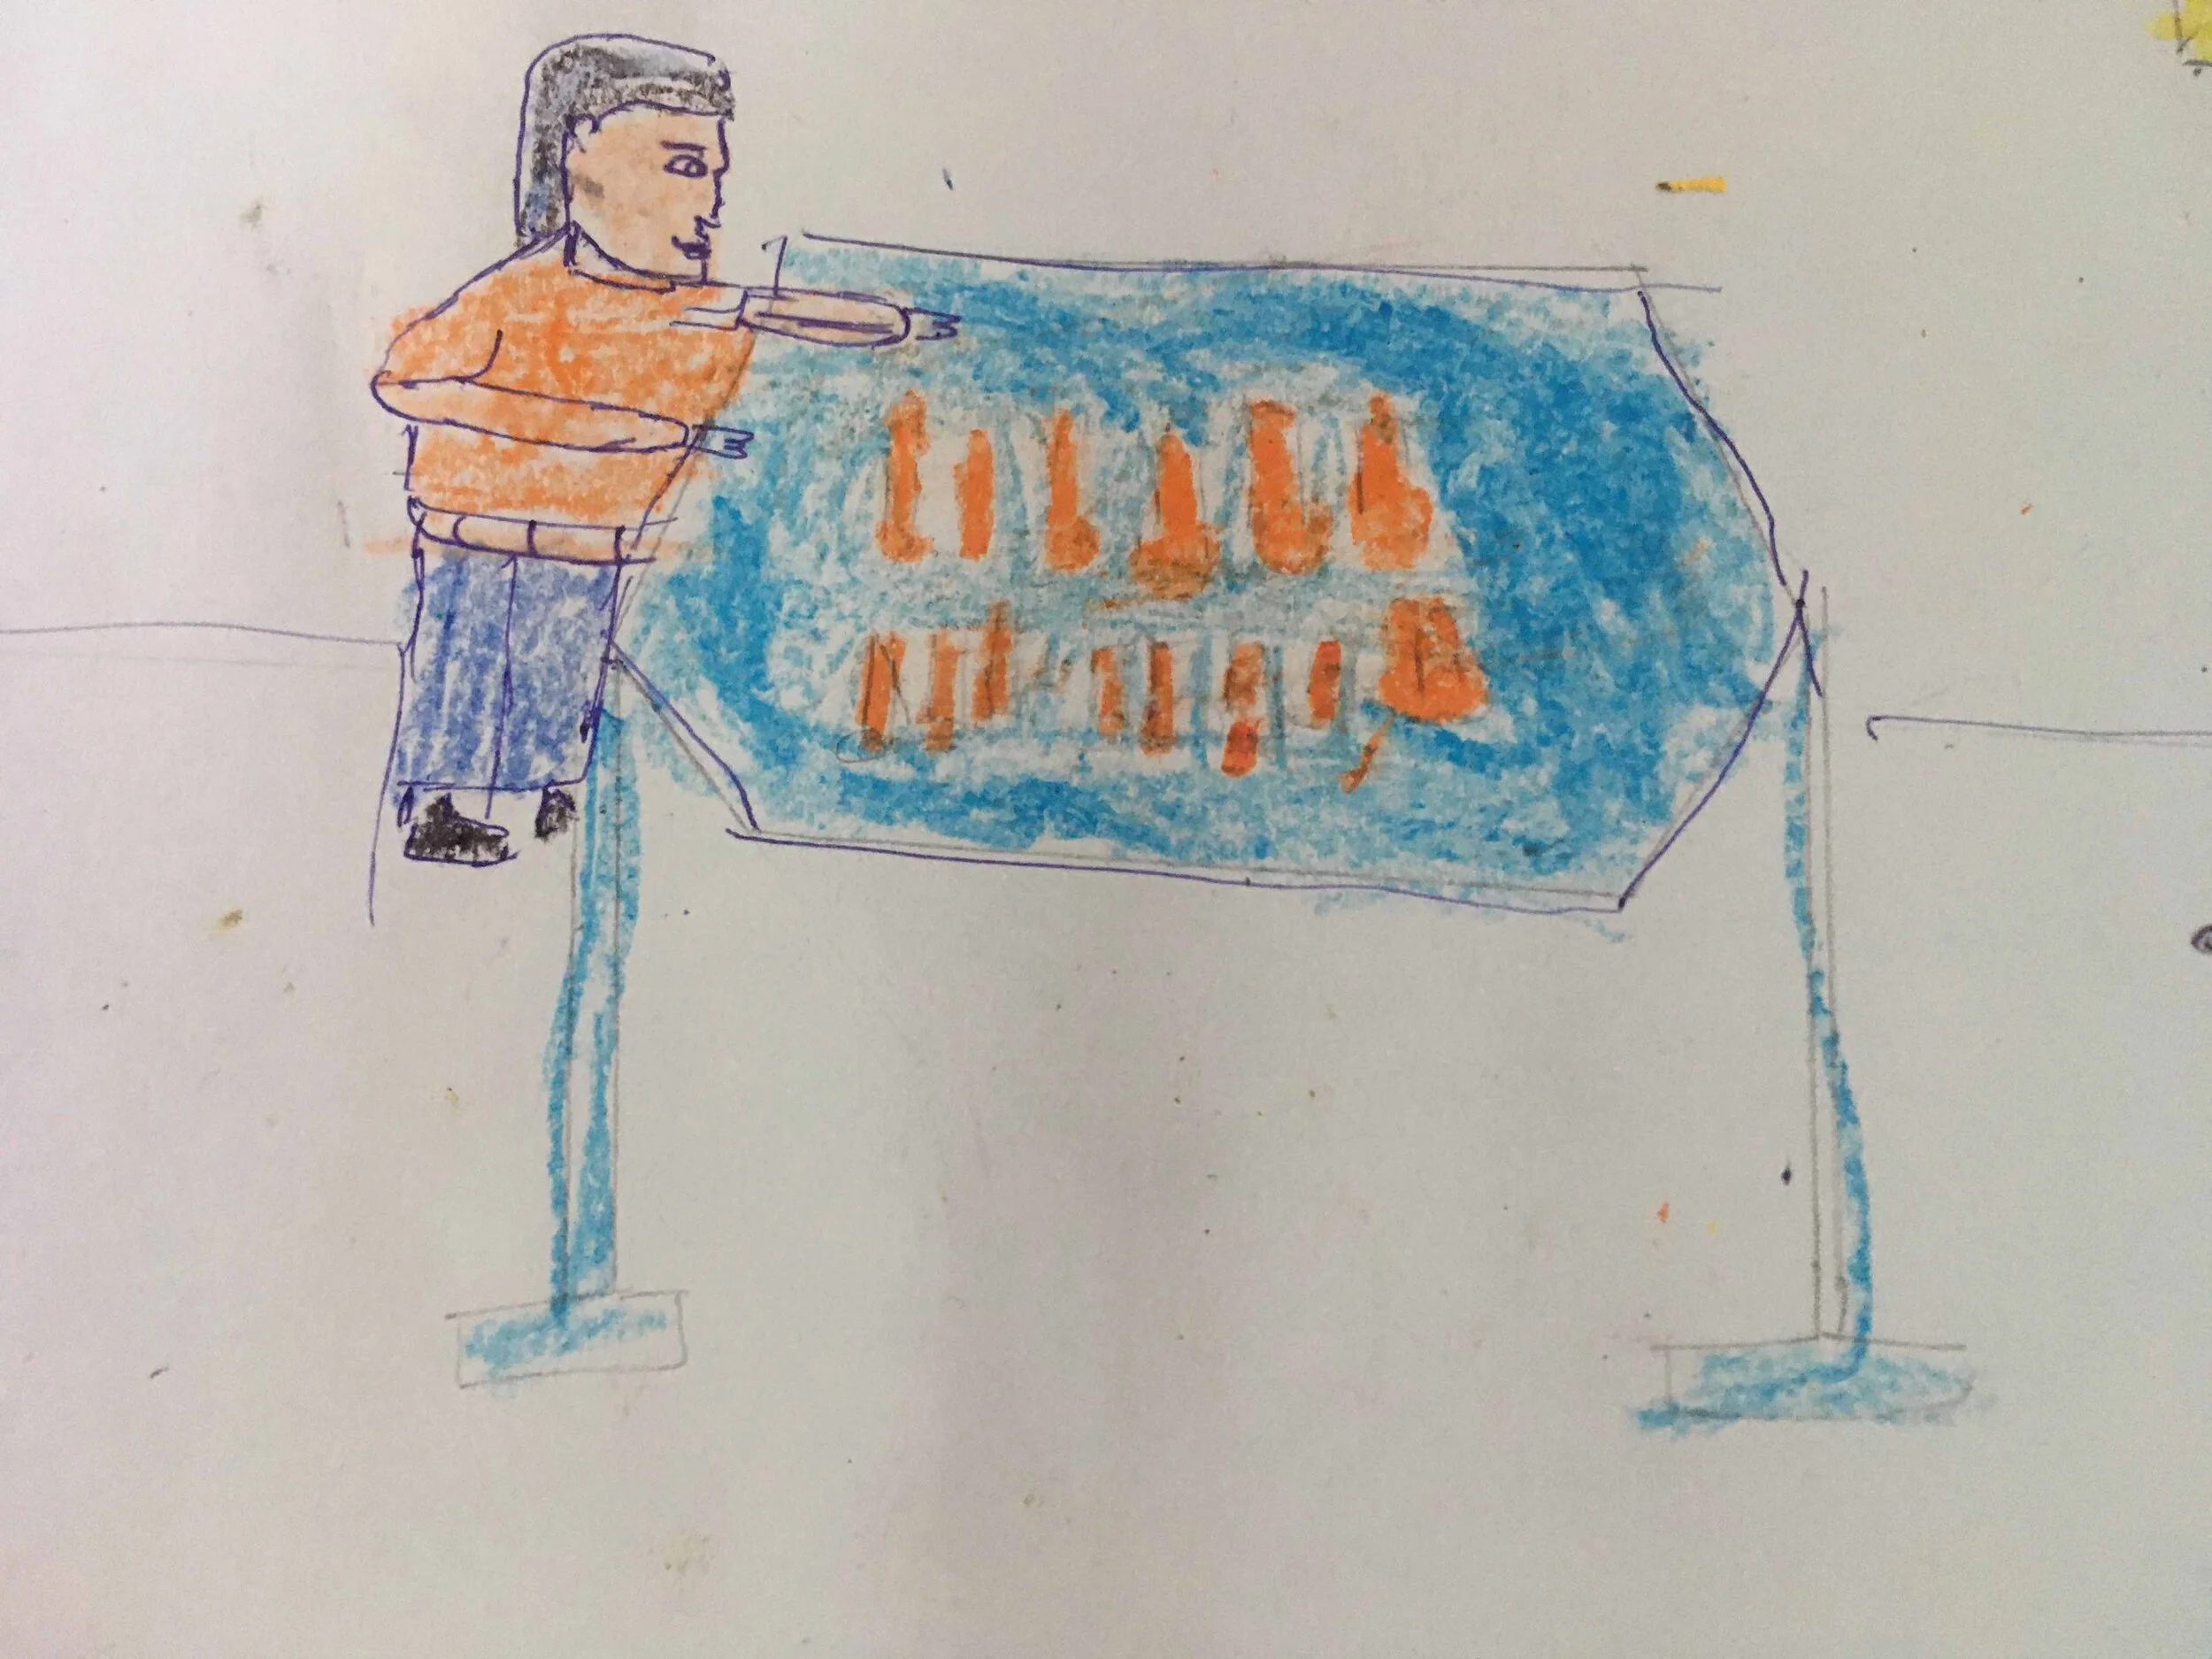
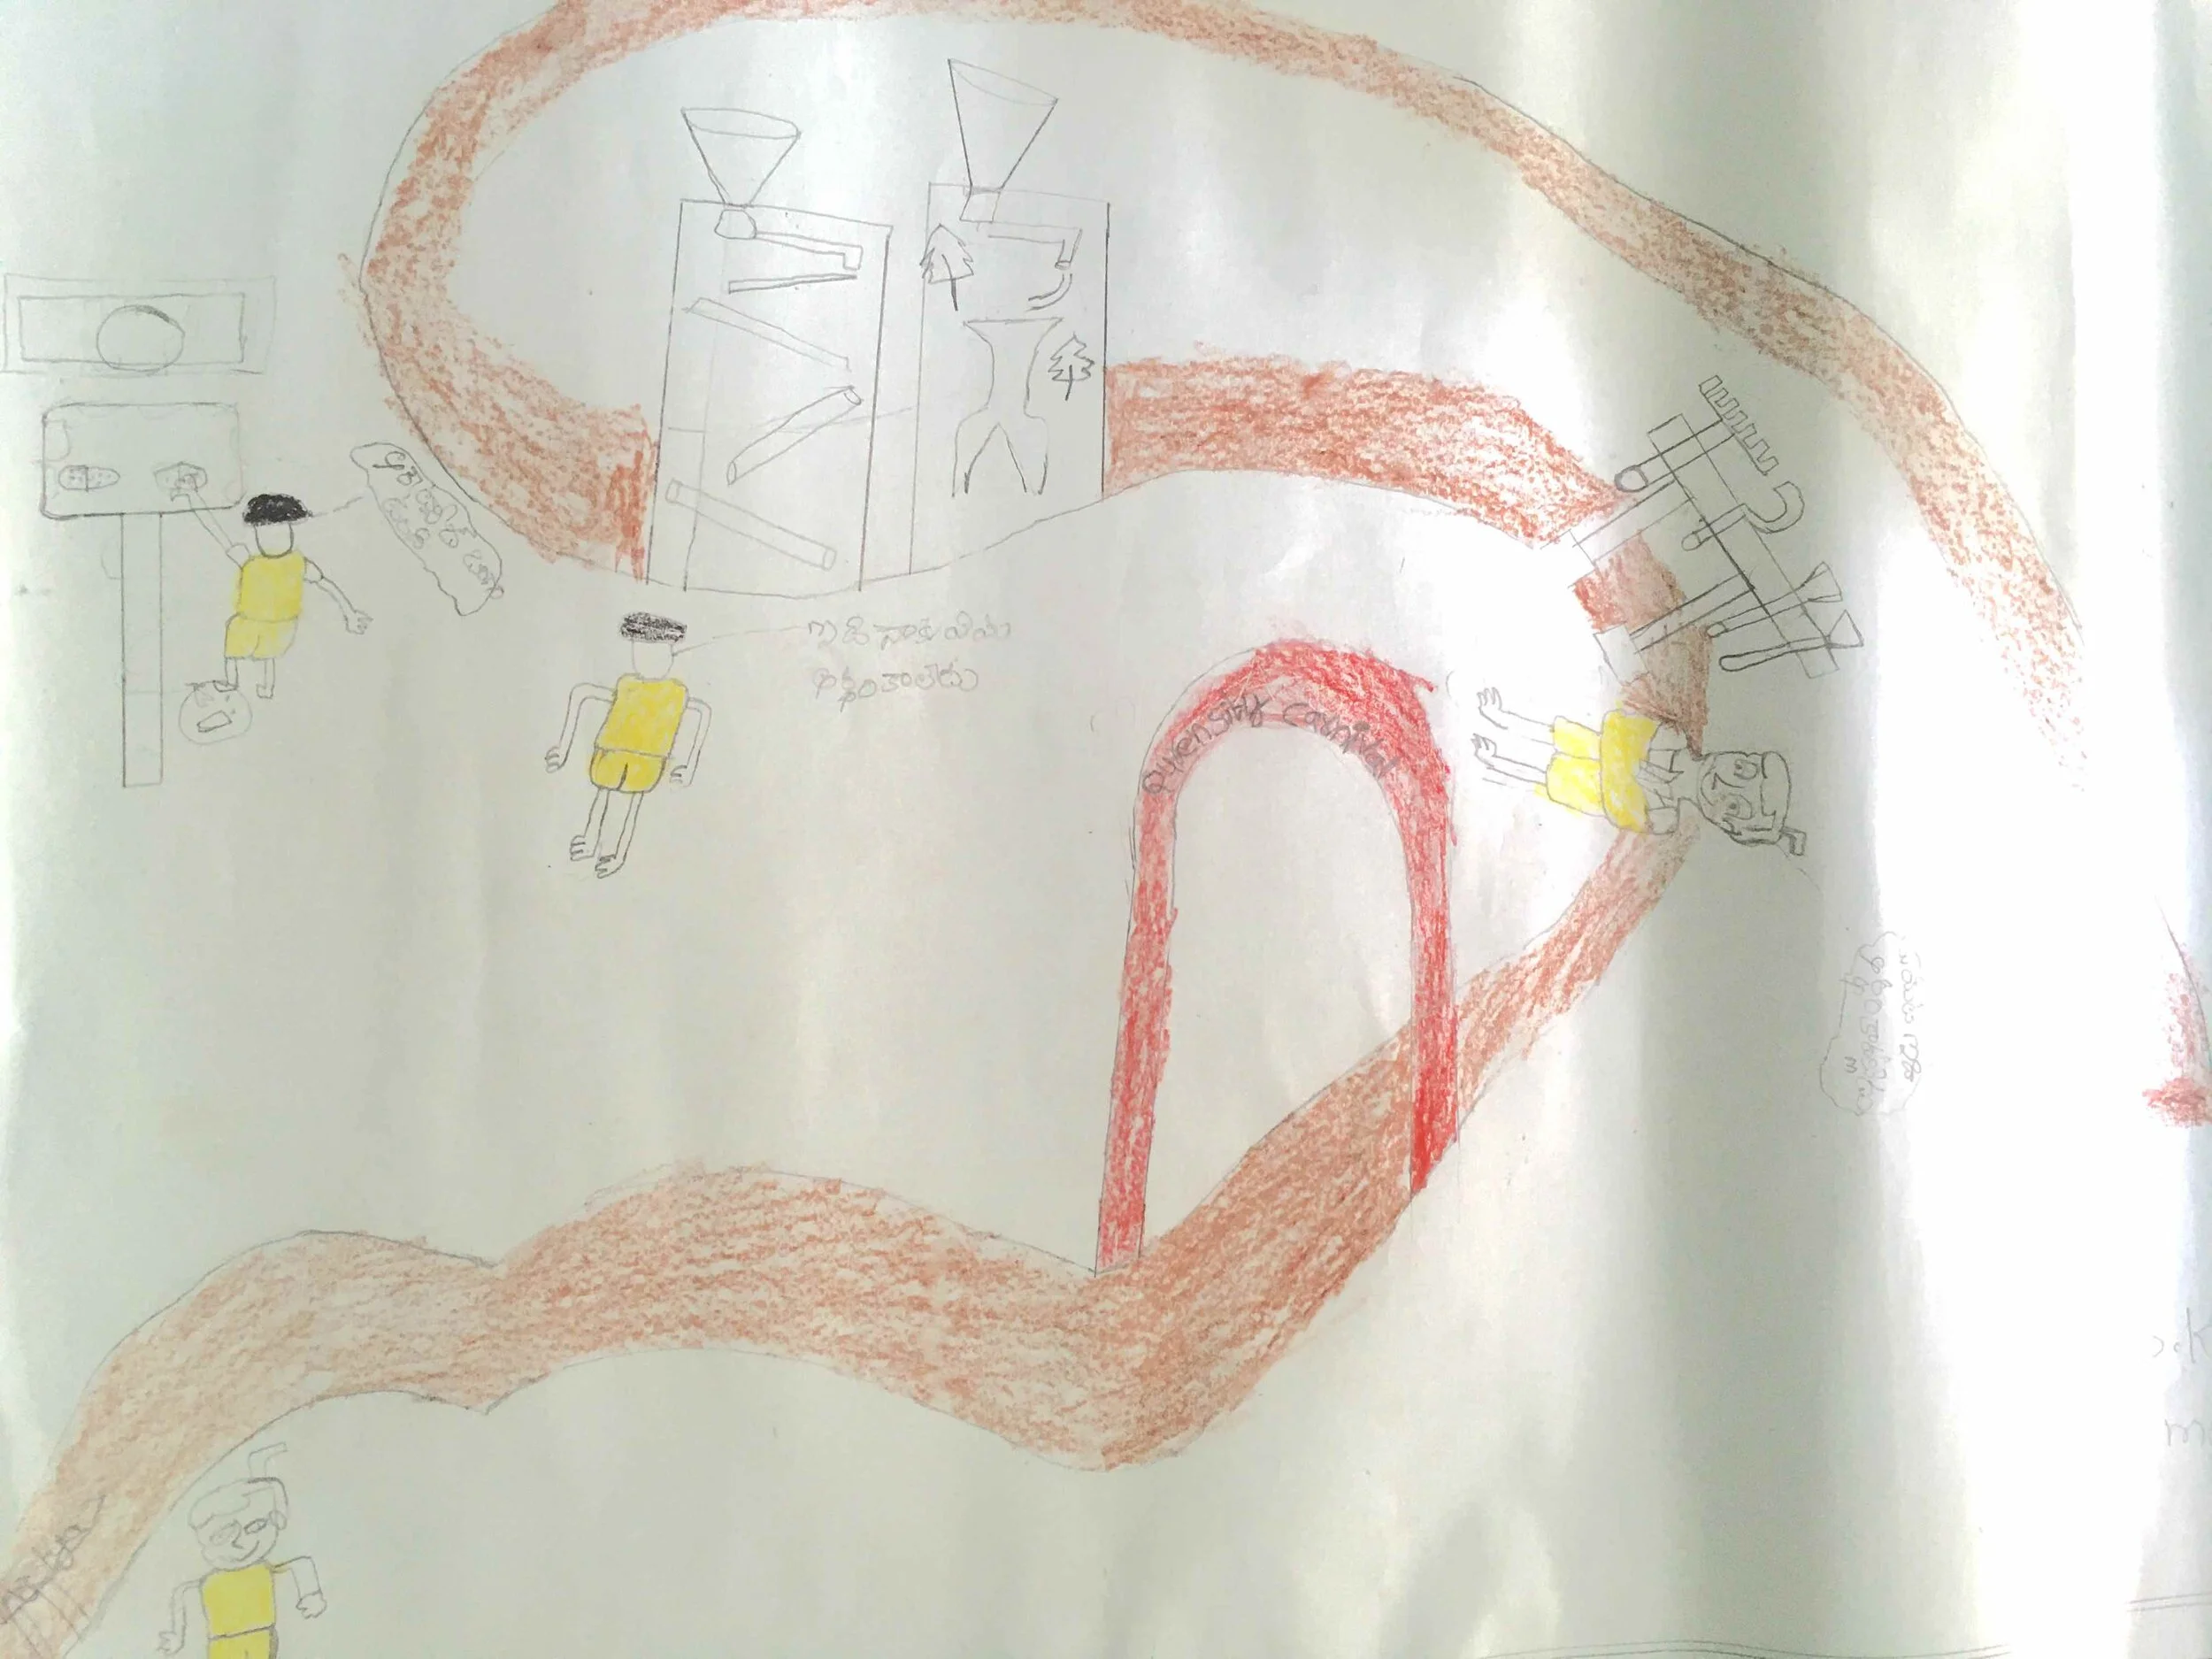
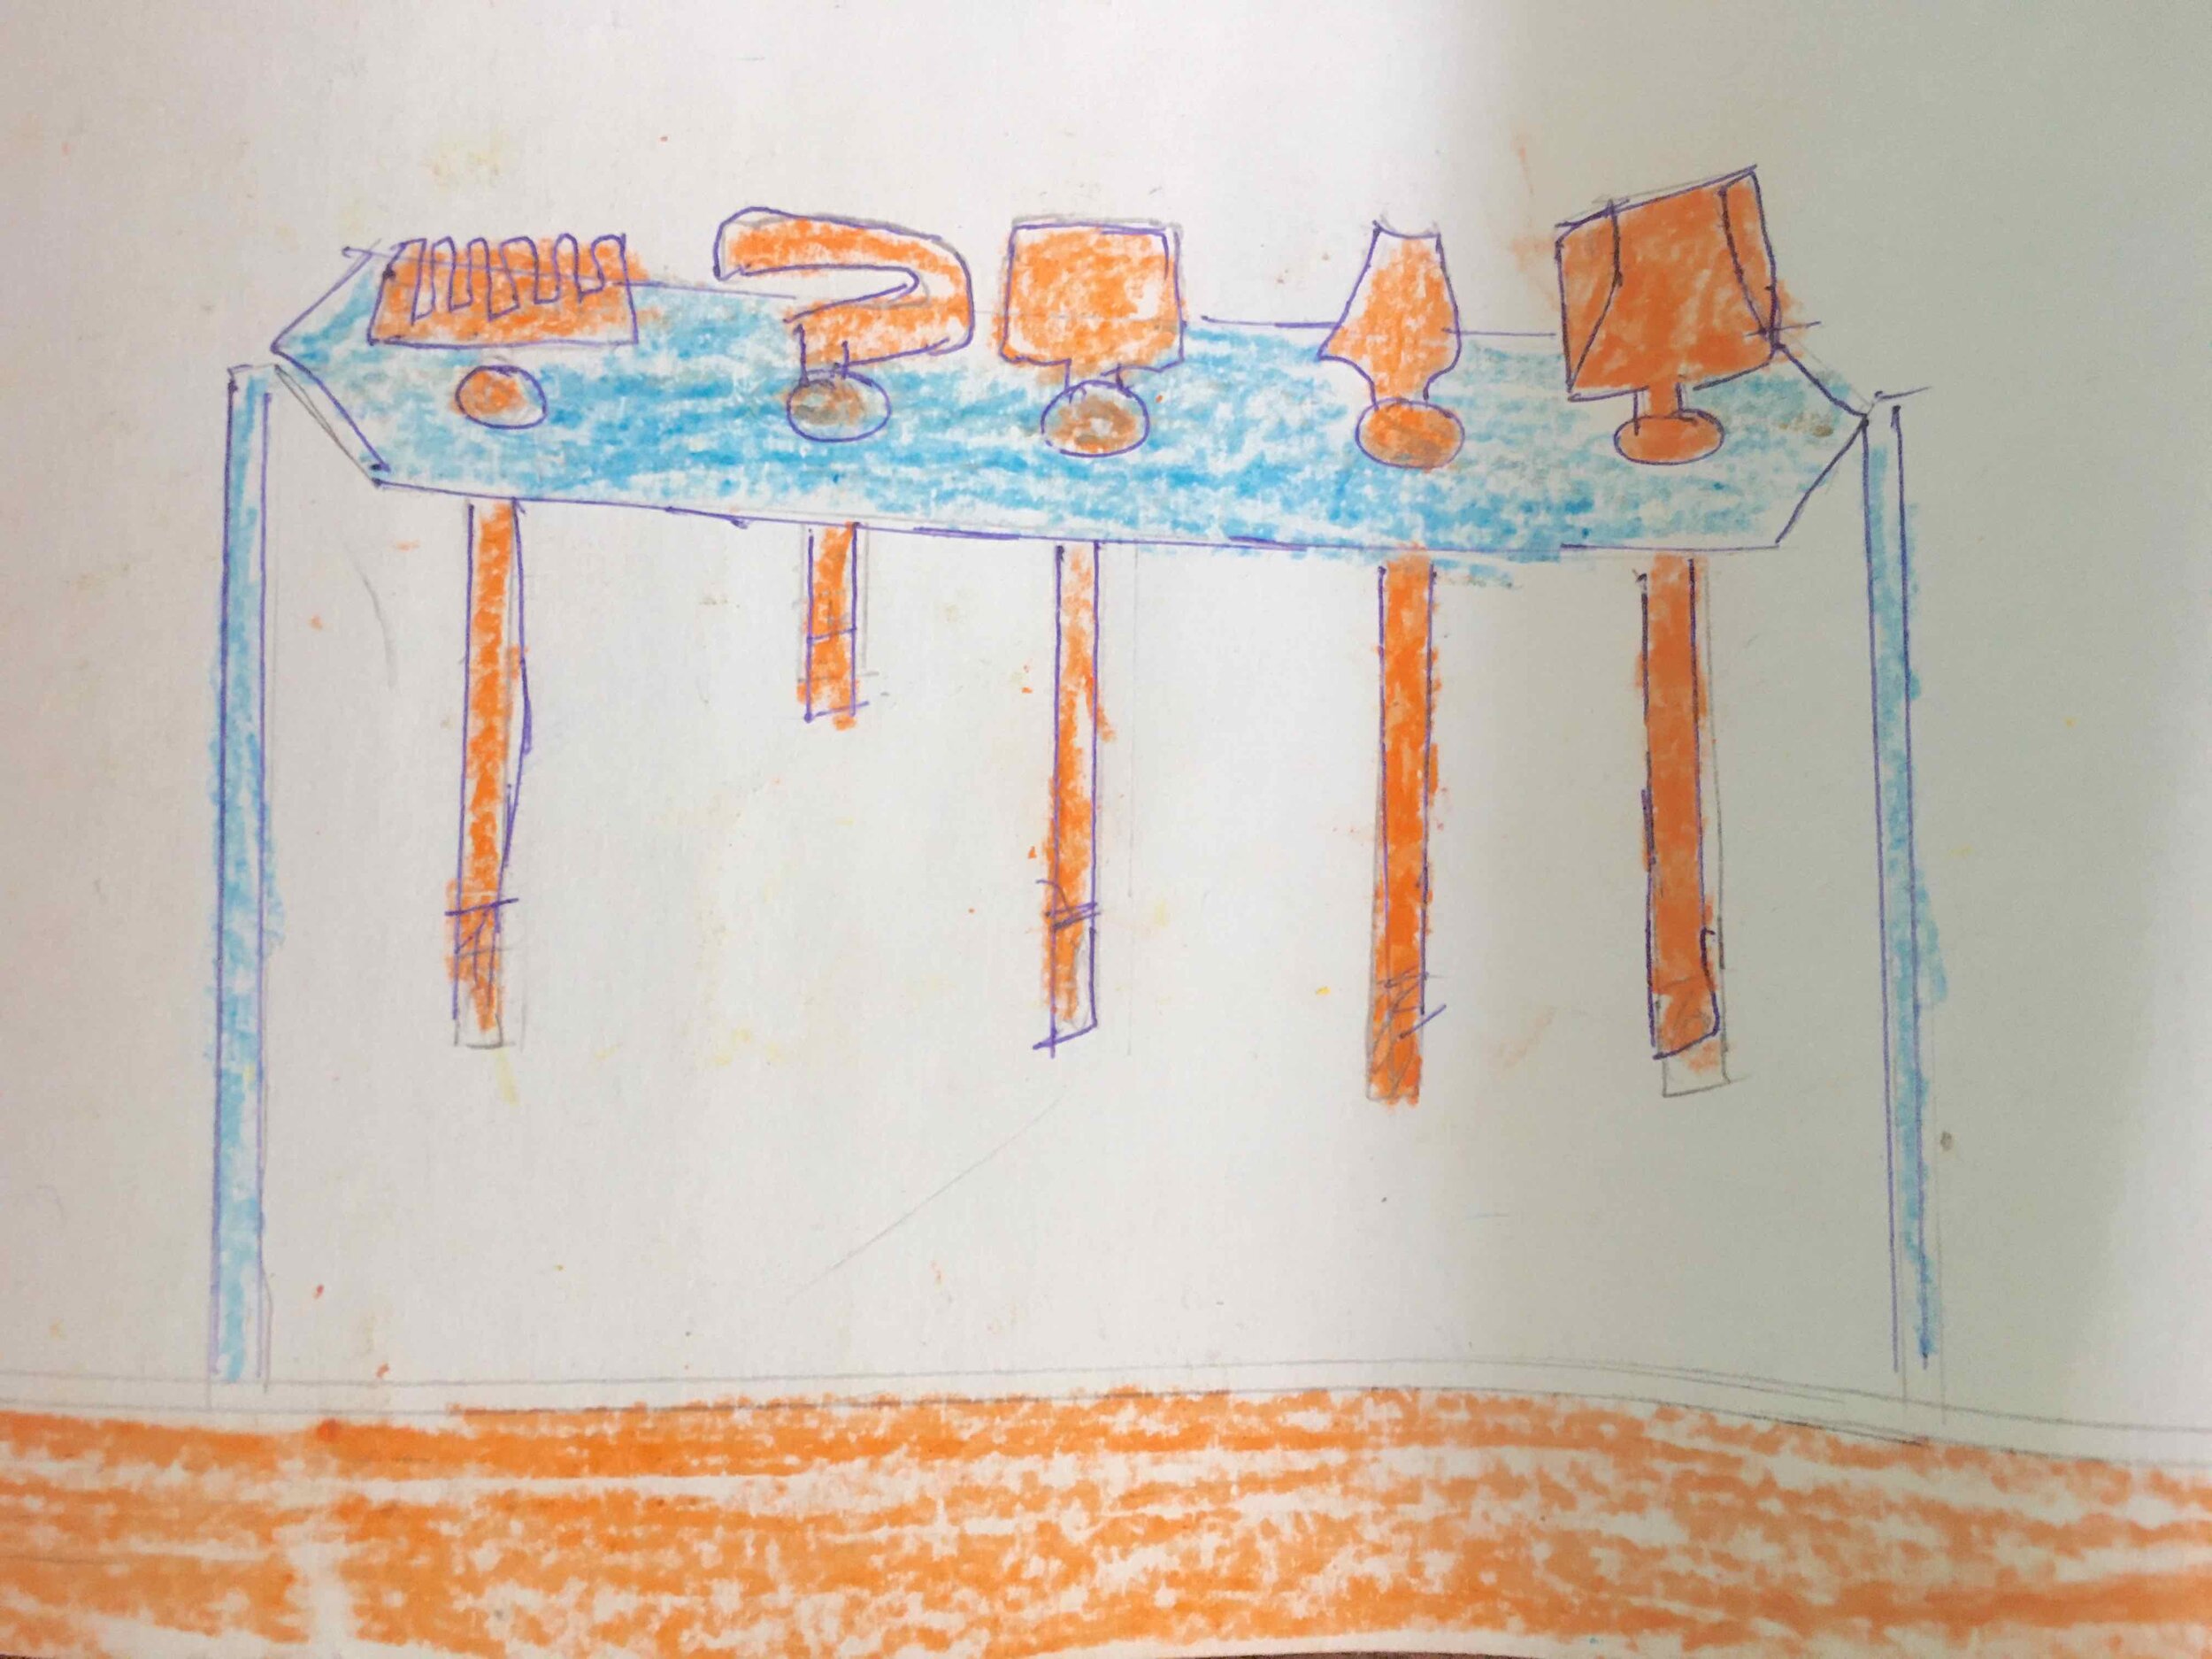
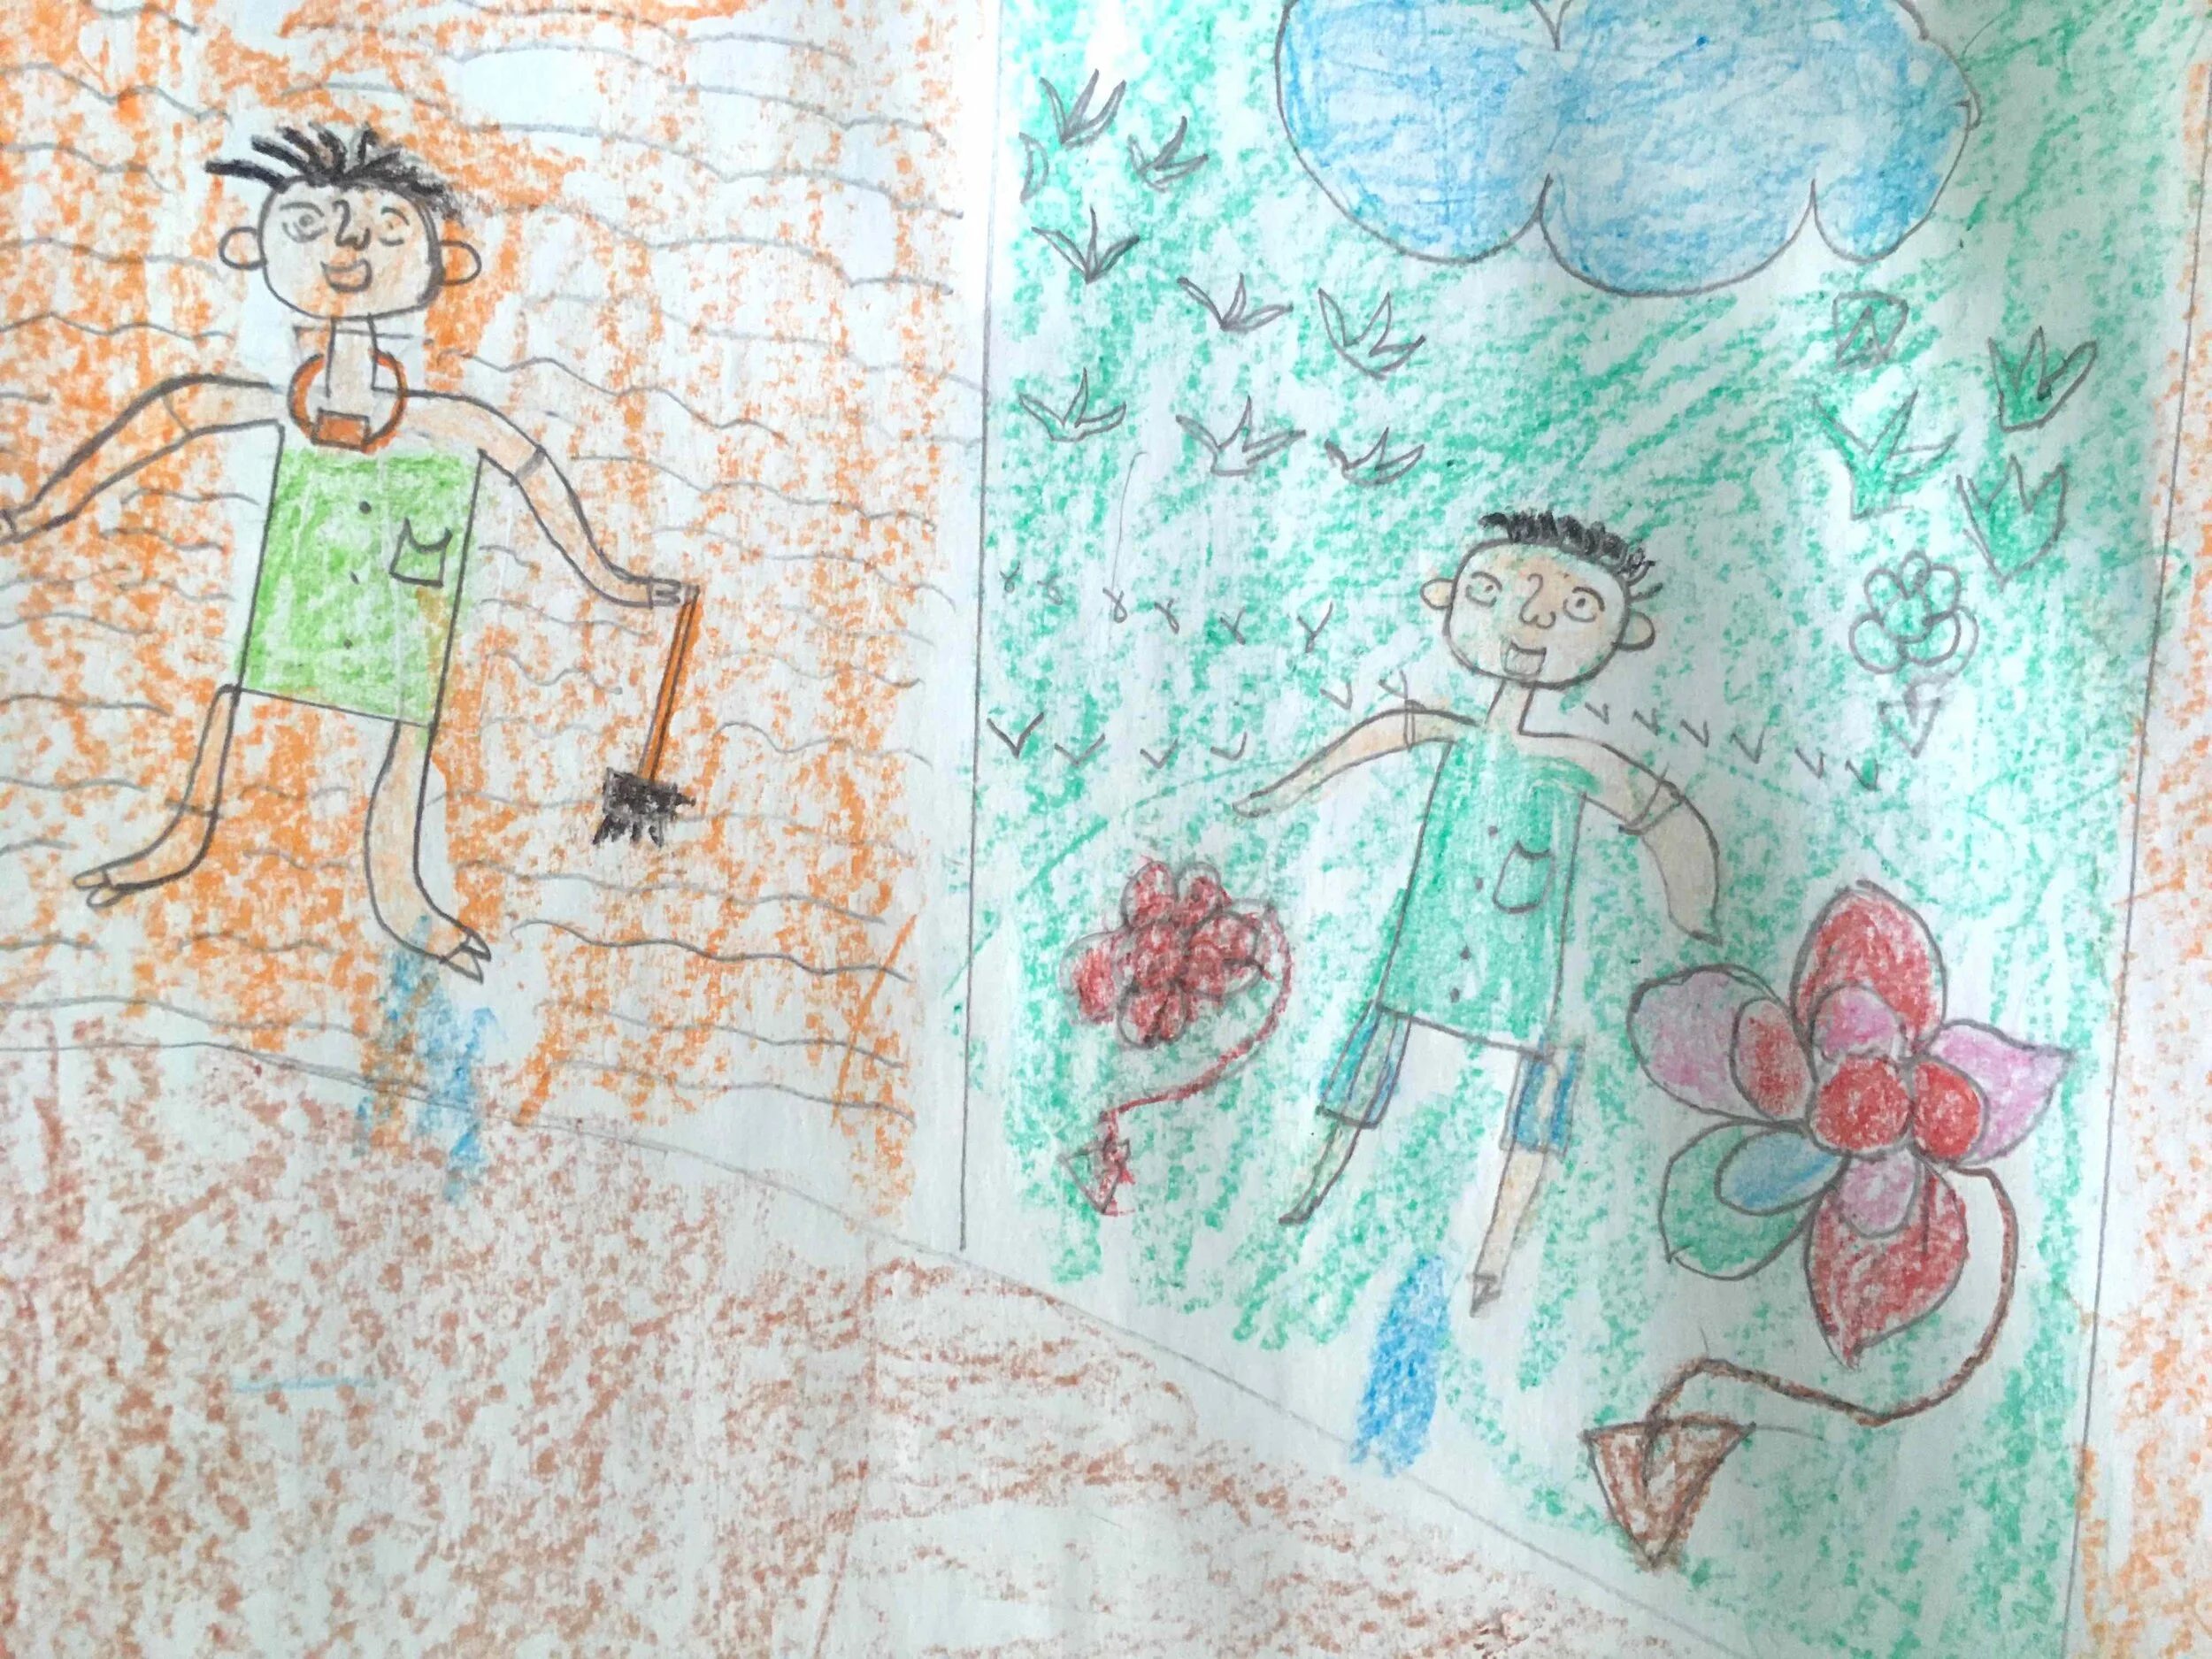
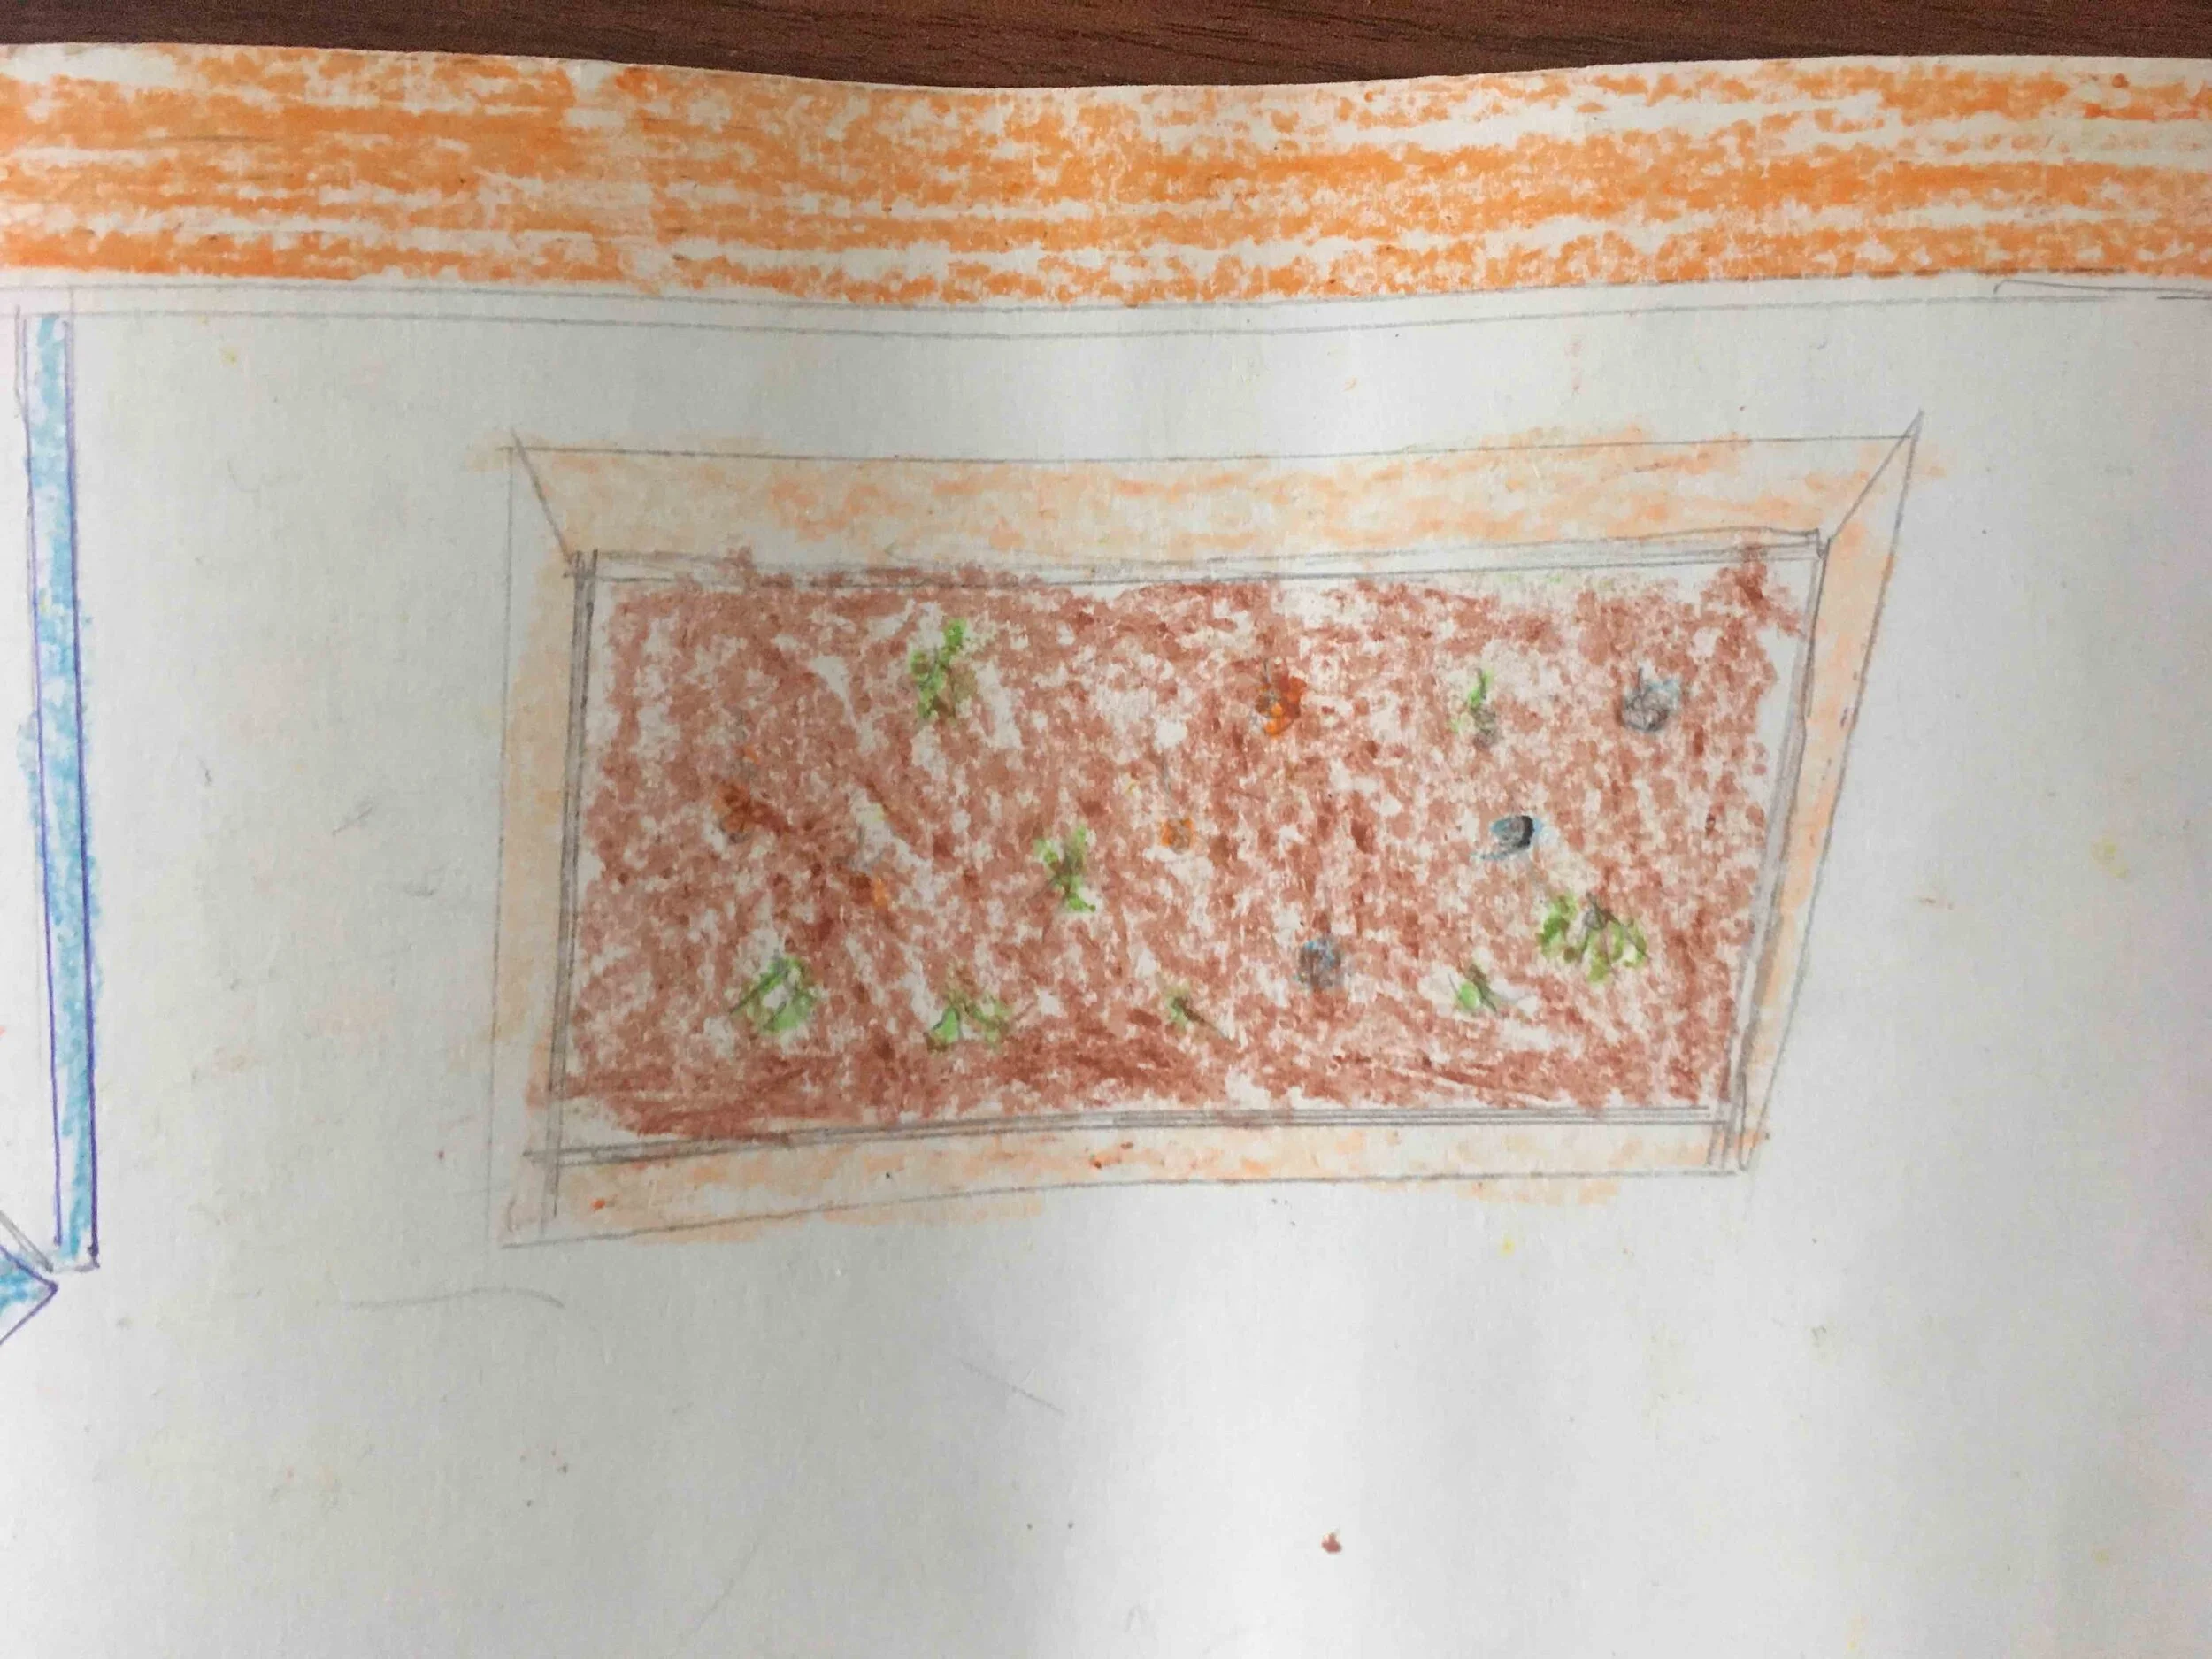
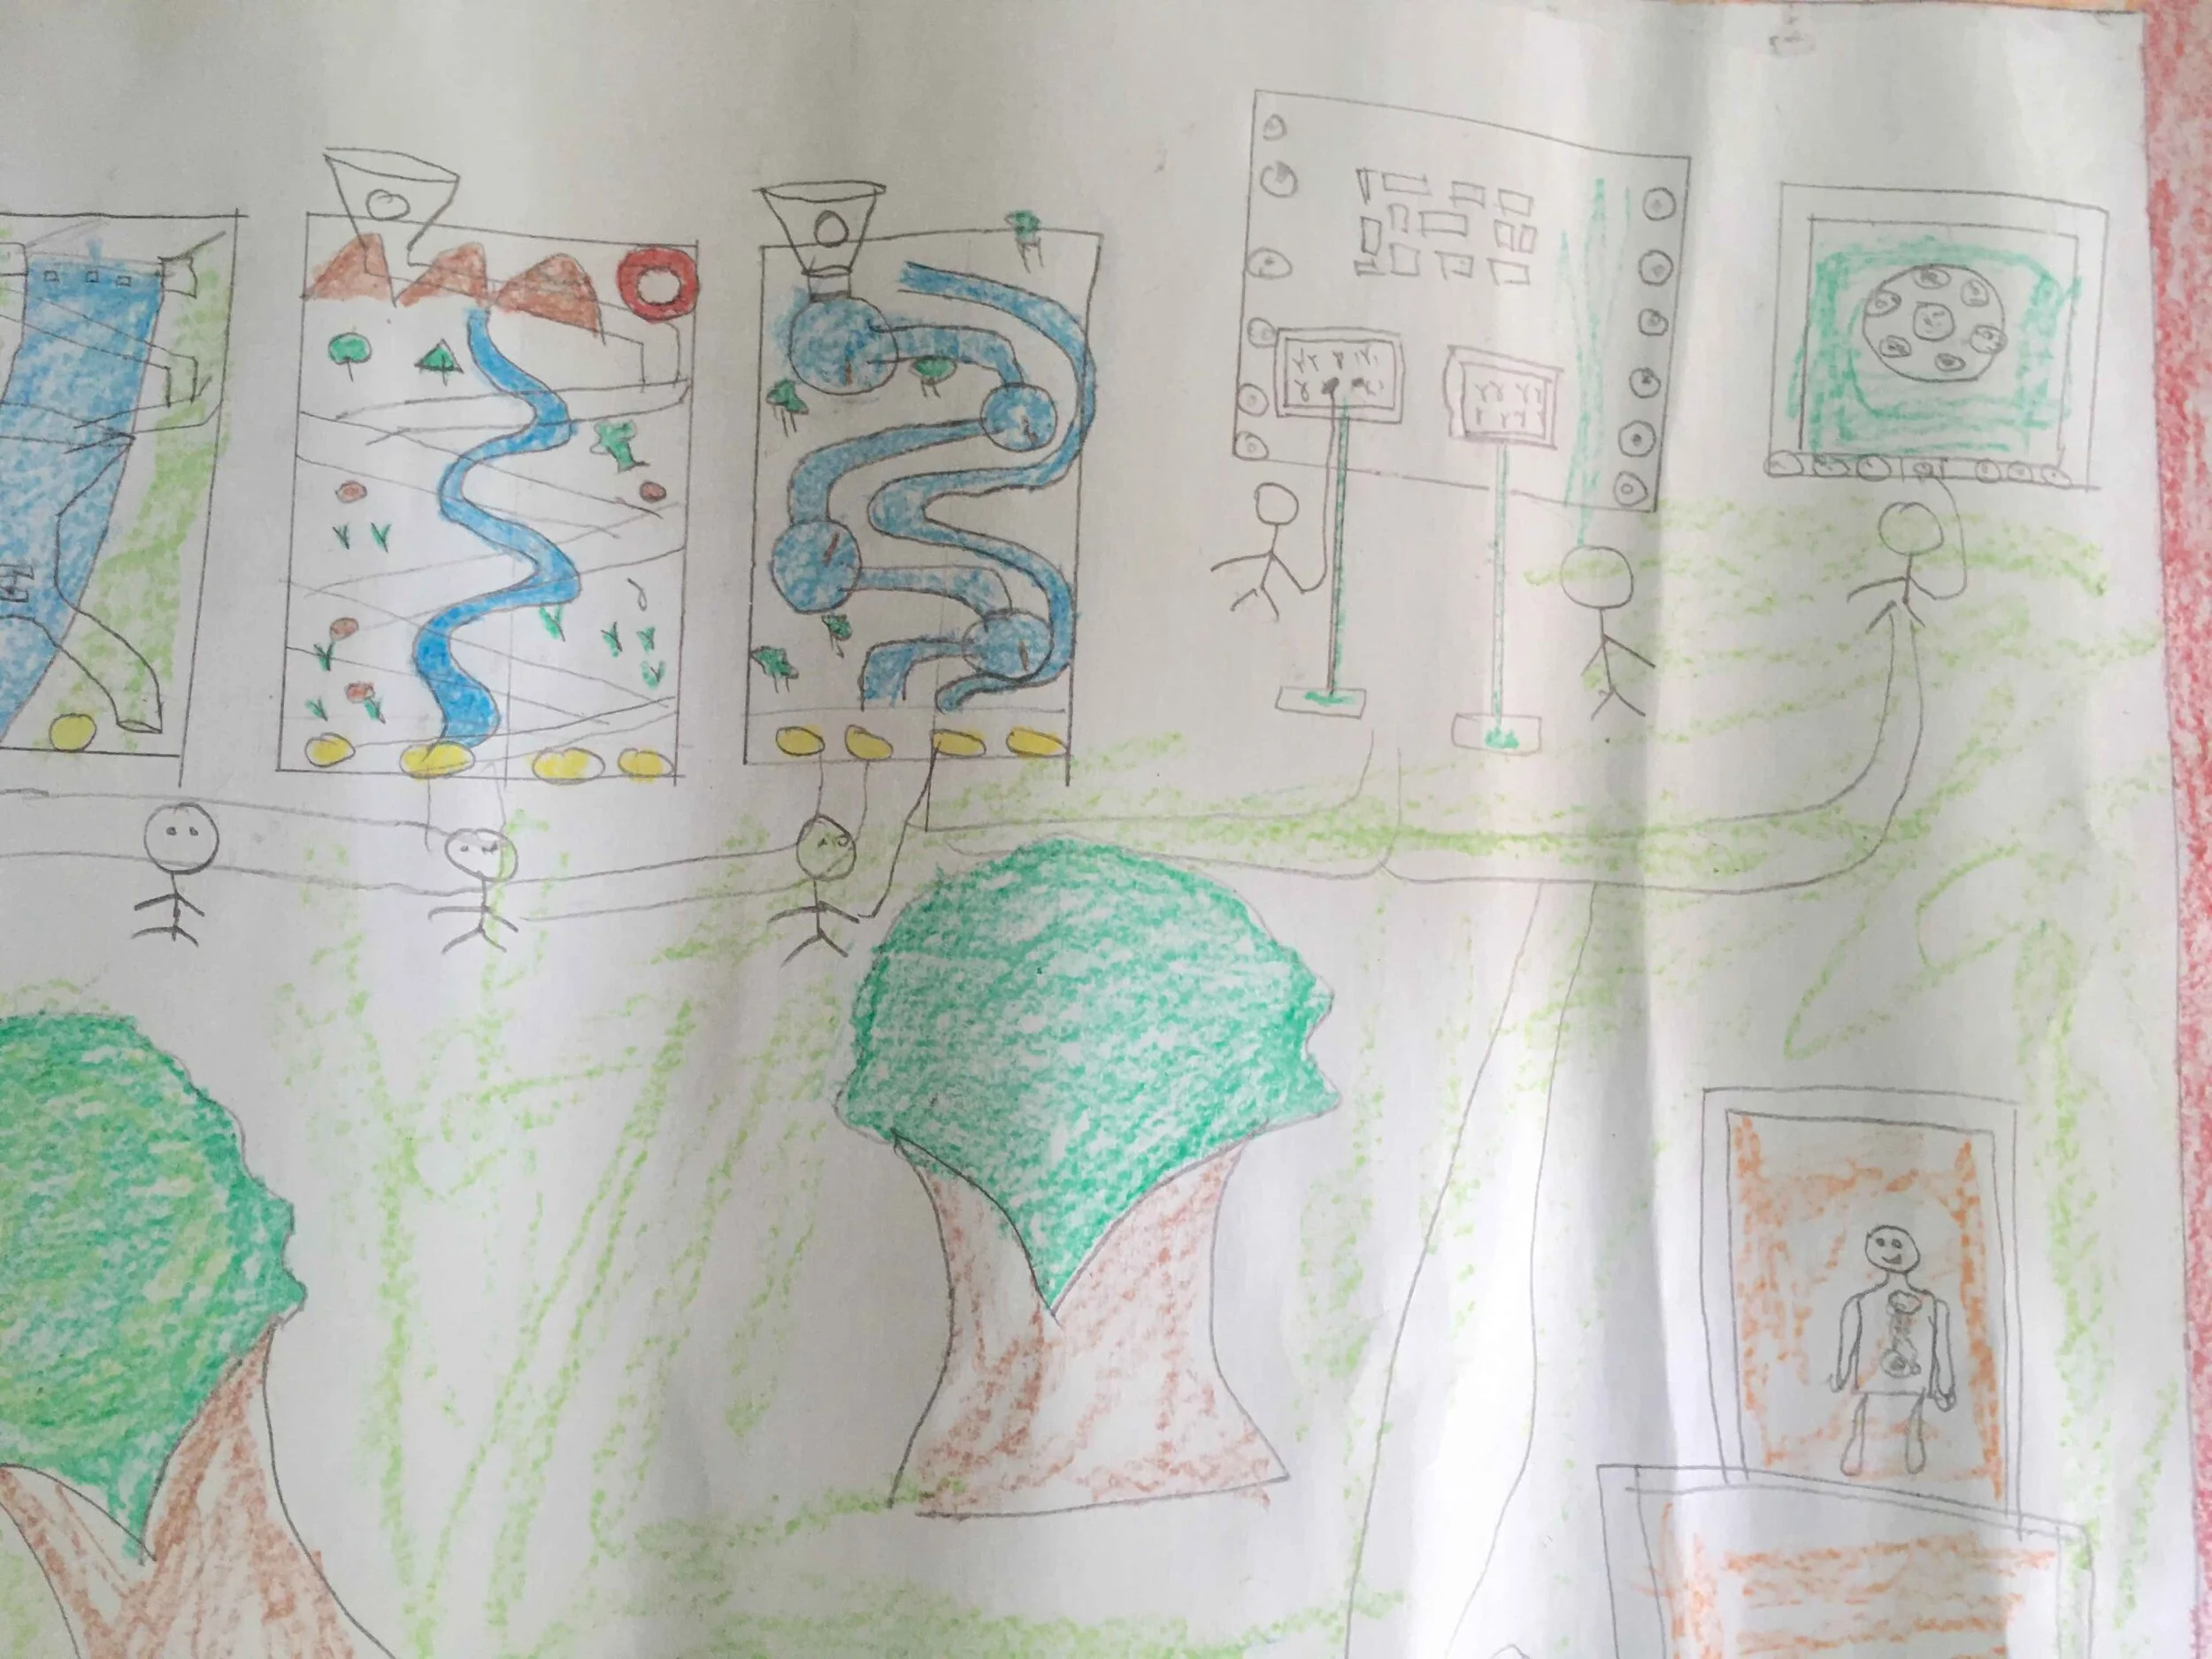
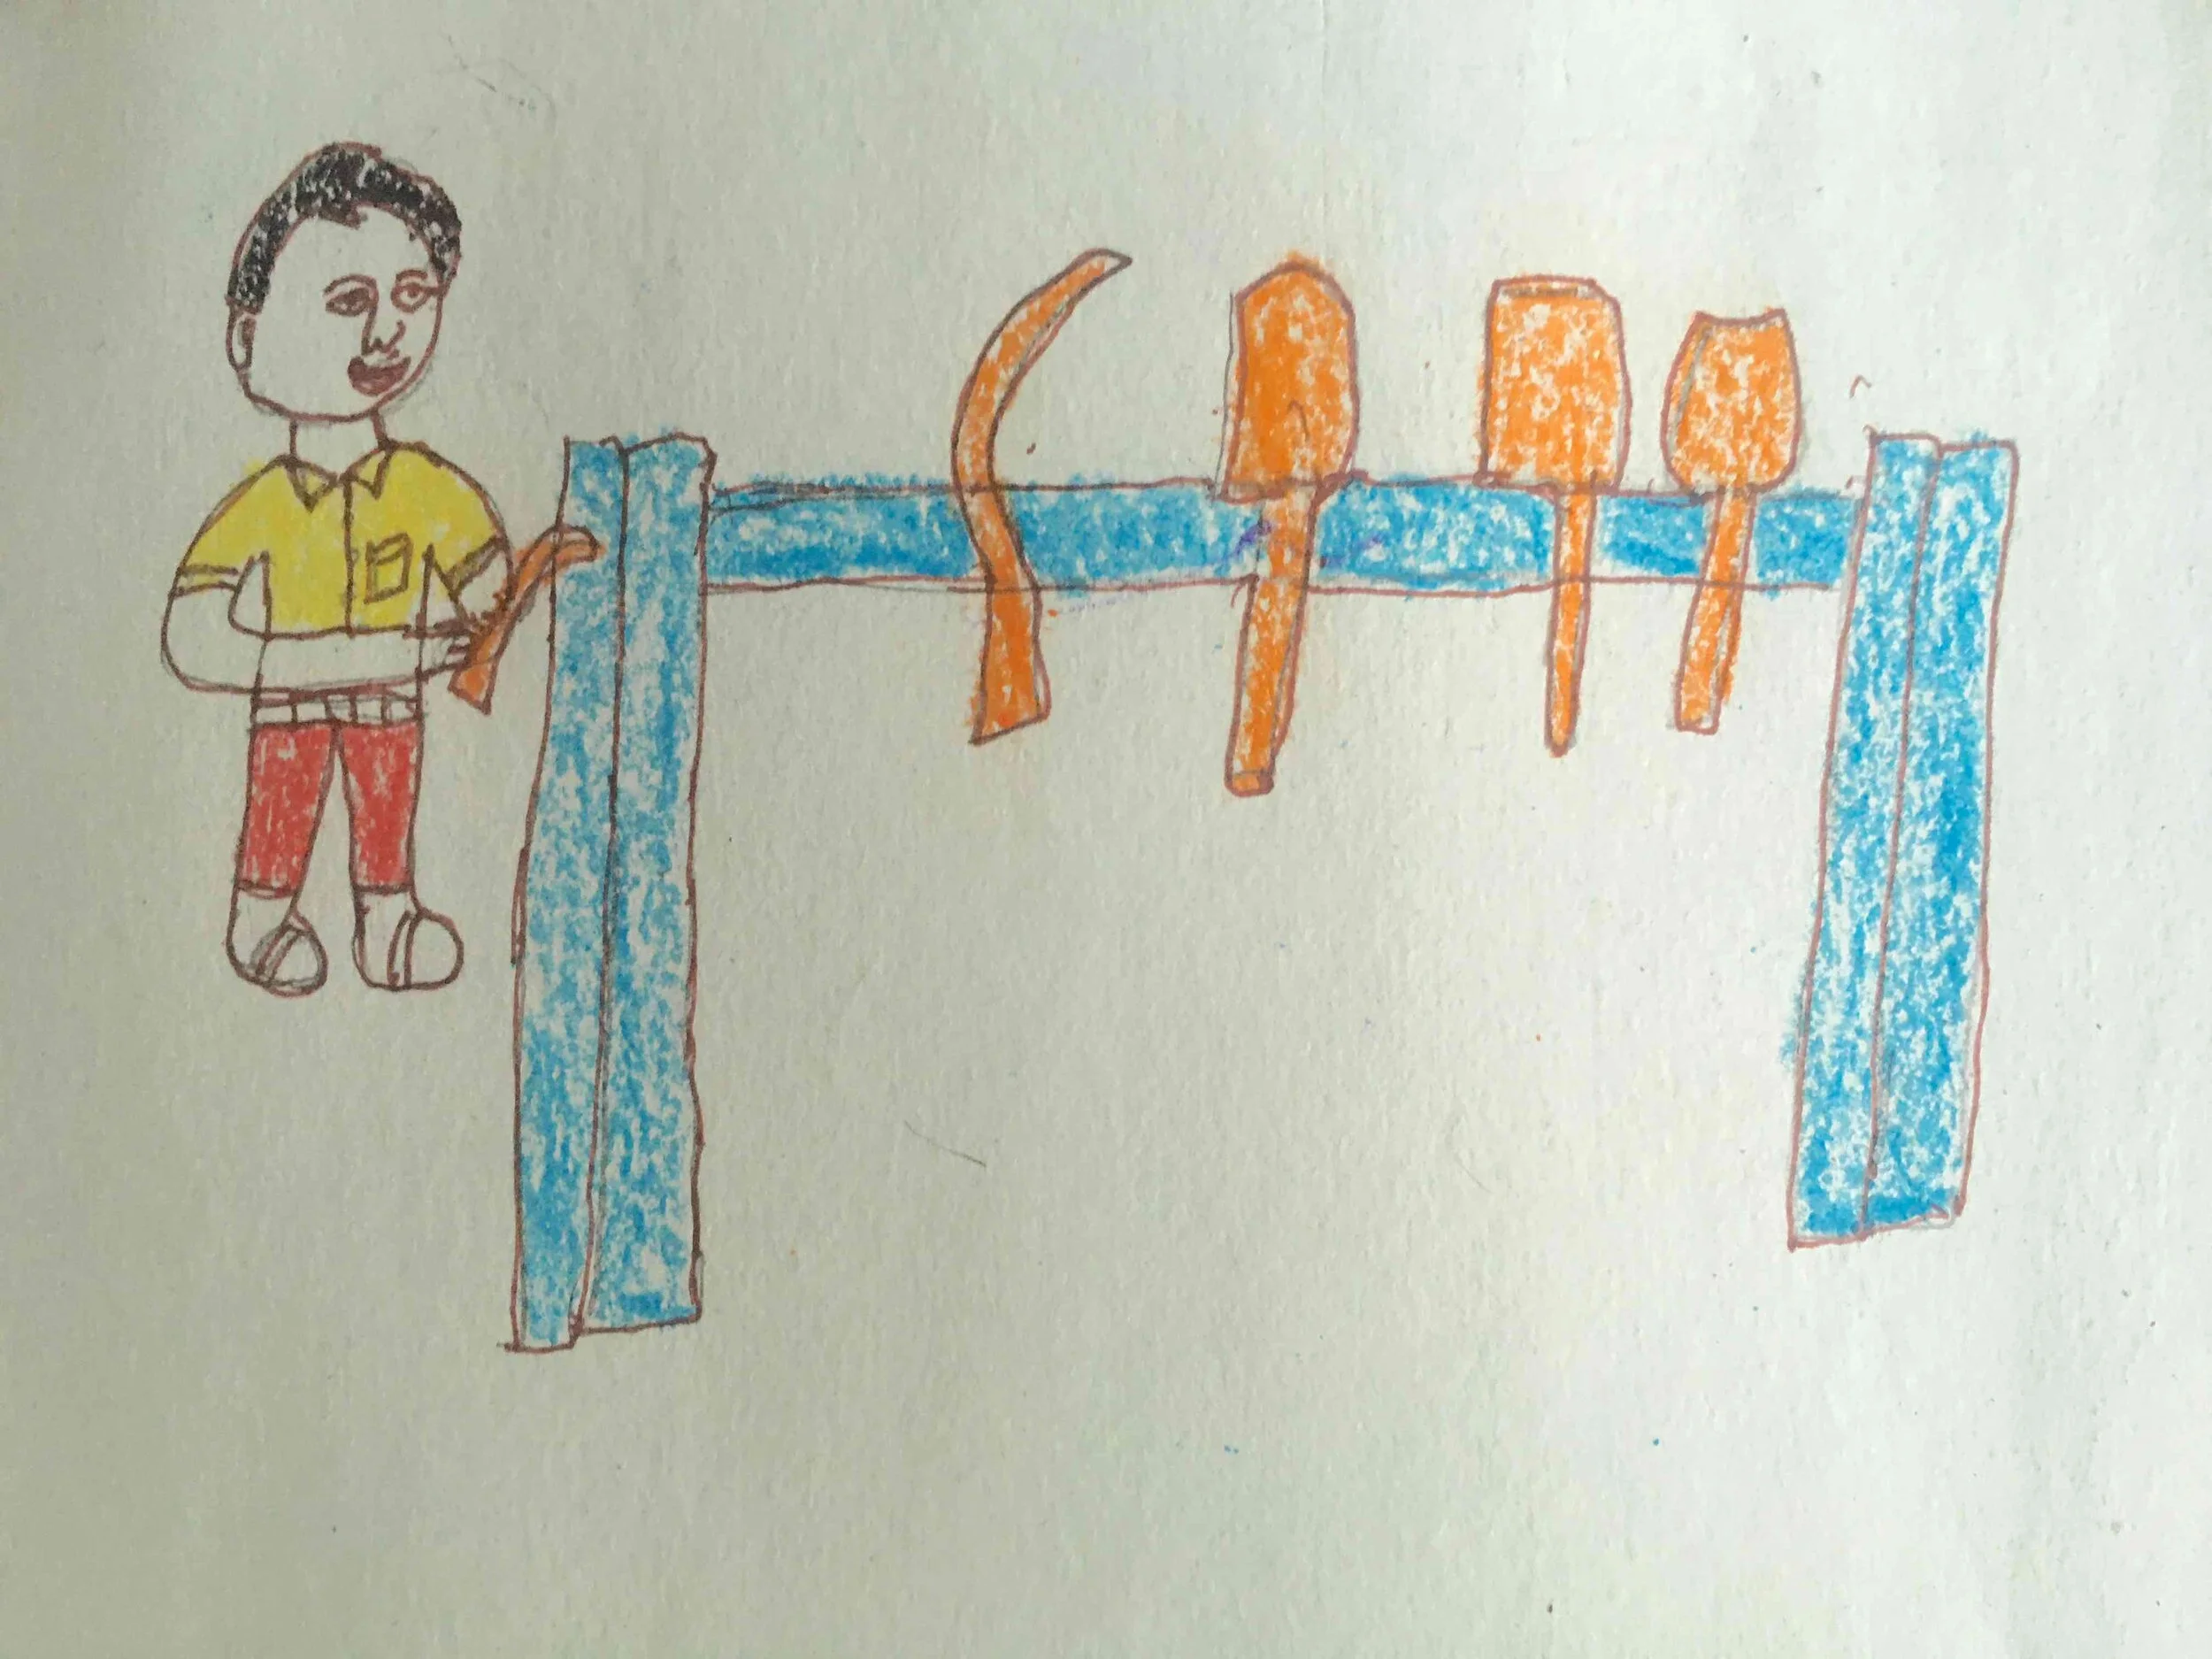
Co-creating maps with children
We finally split the children in groups and asked them to illustrate their own maps for these exhibits. This exercise gave me plenty of insights into how the children relate visually to the exhibits and their strong need for a protagonist/character in the illustration.

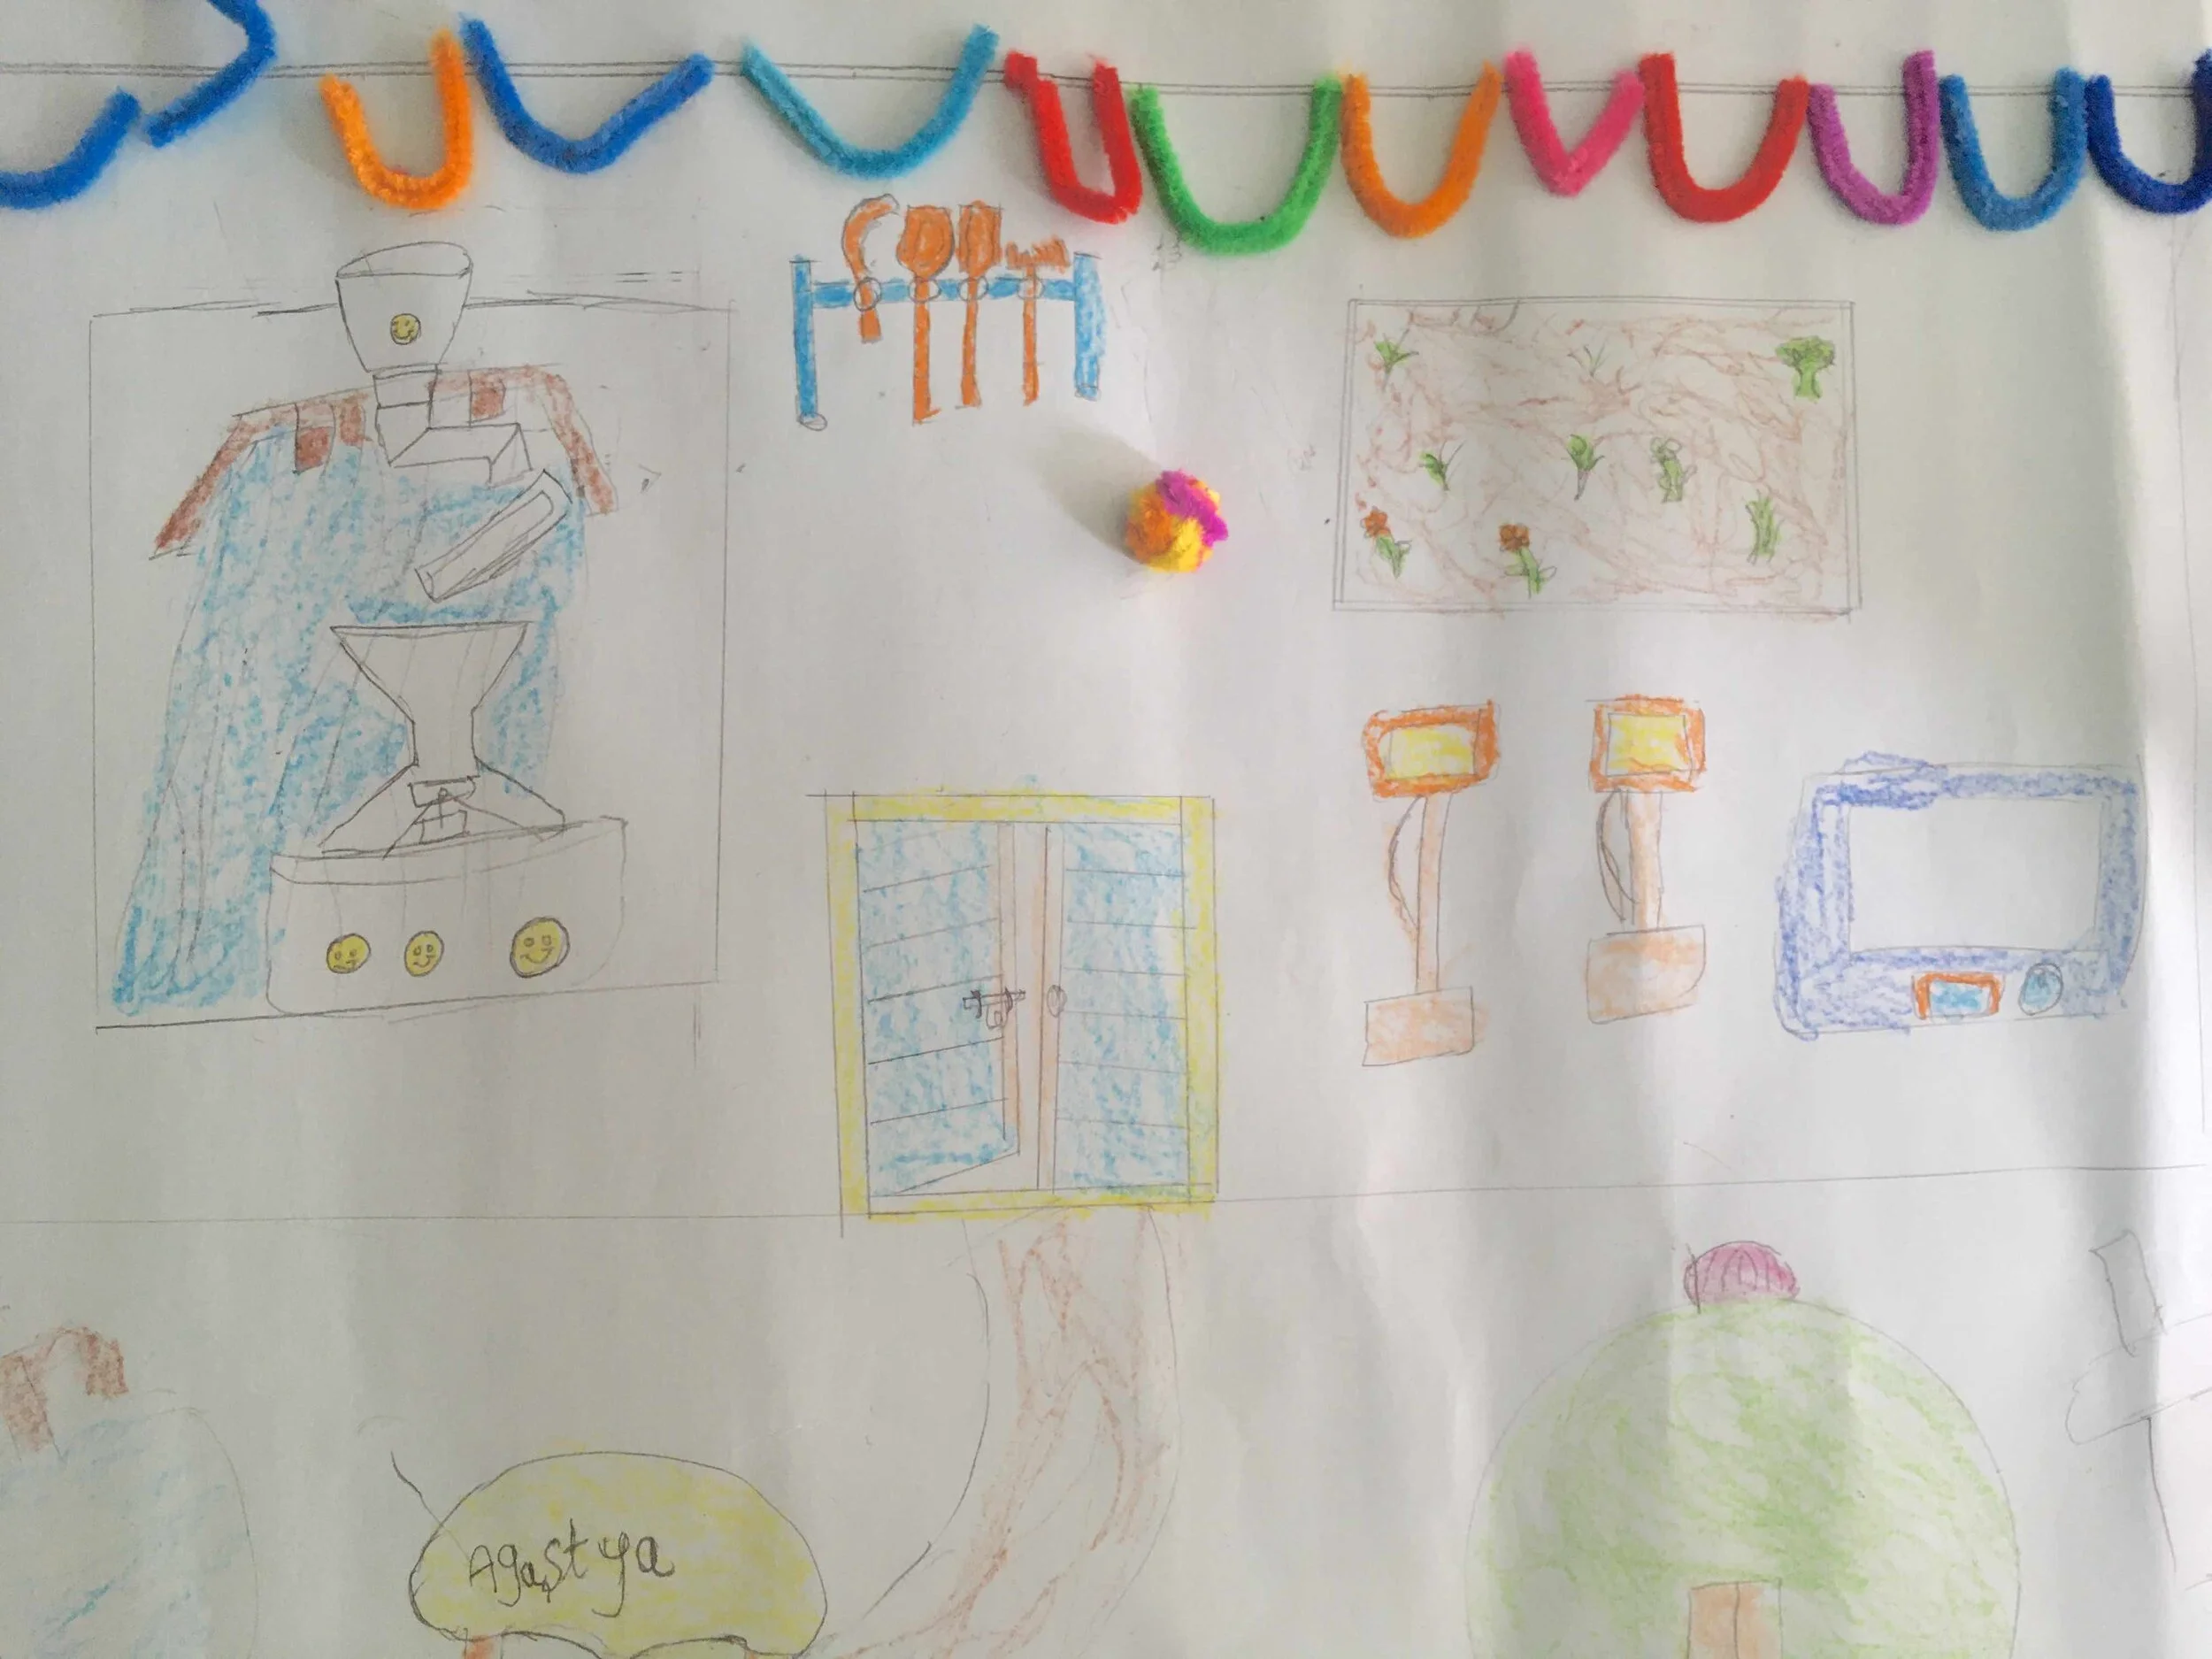

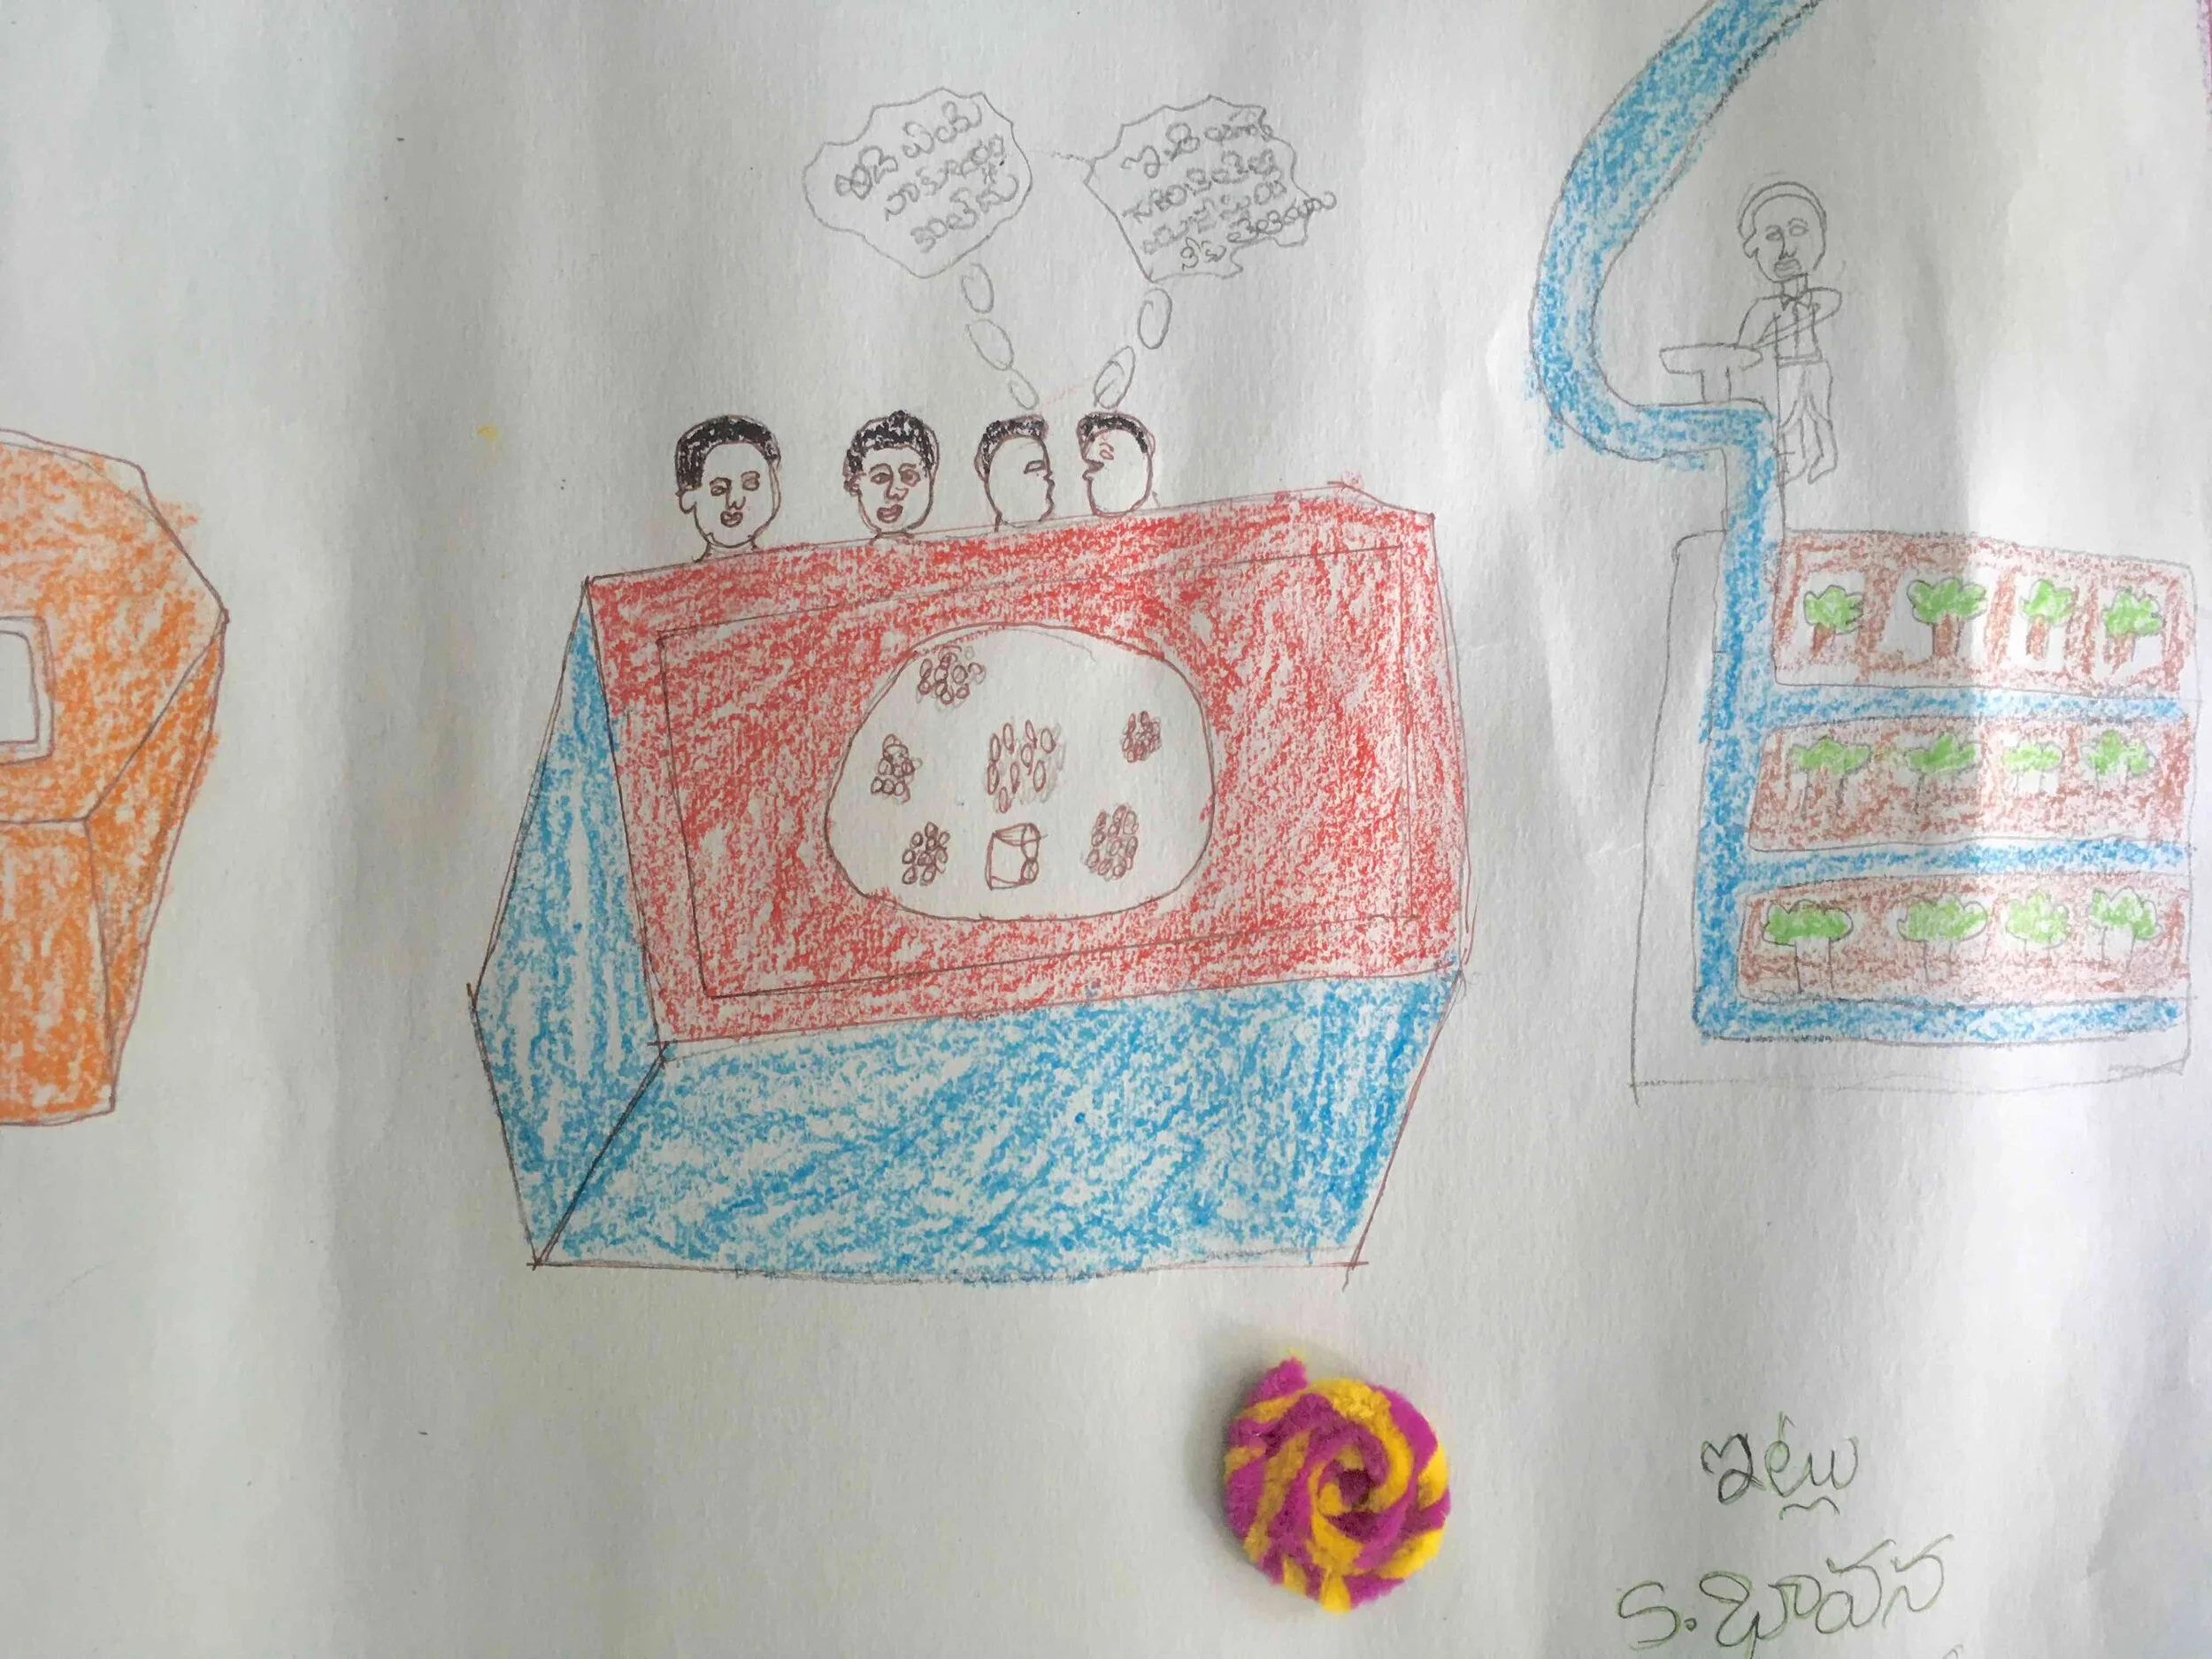
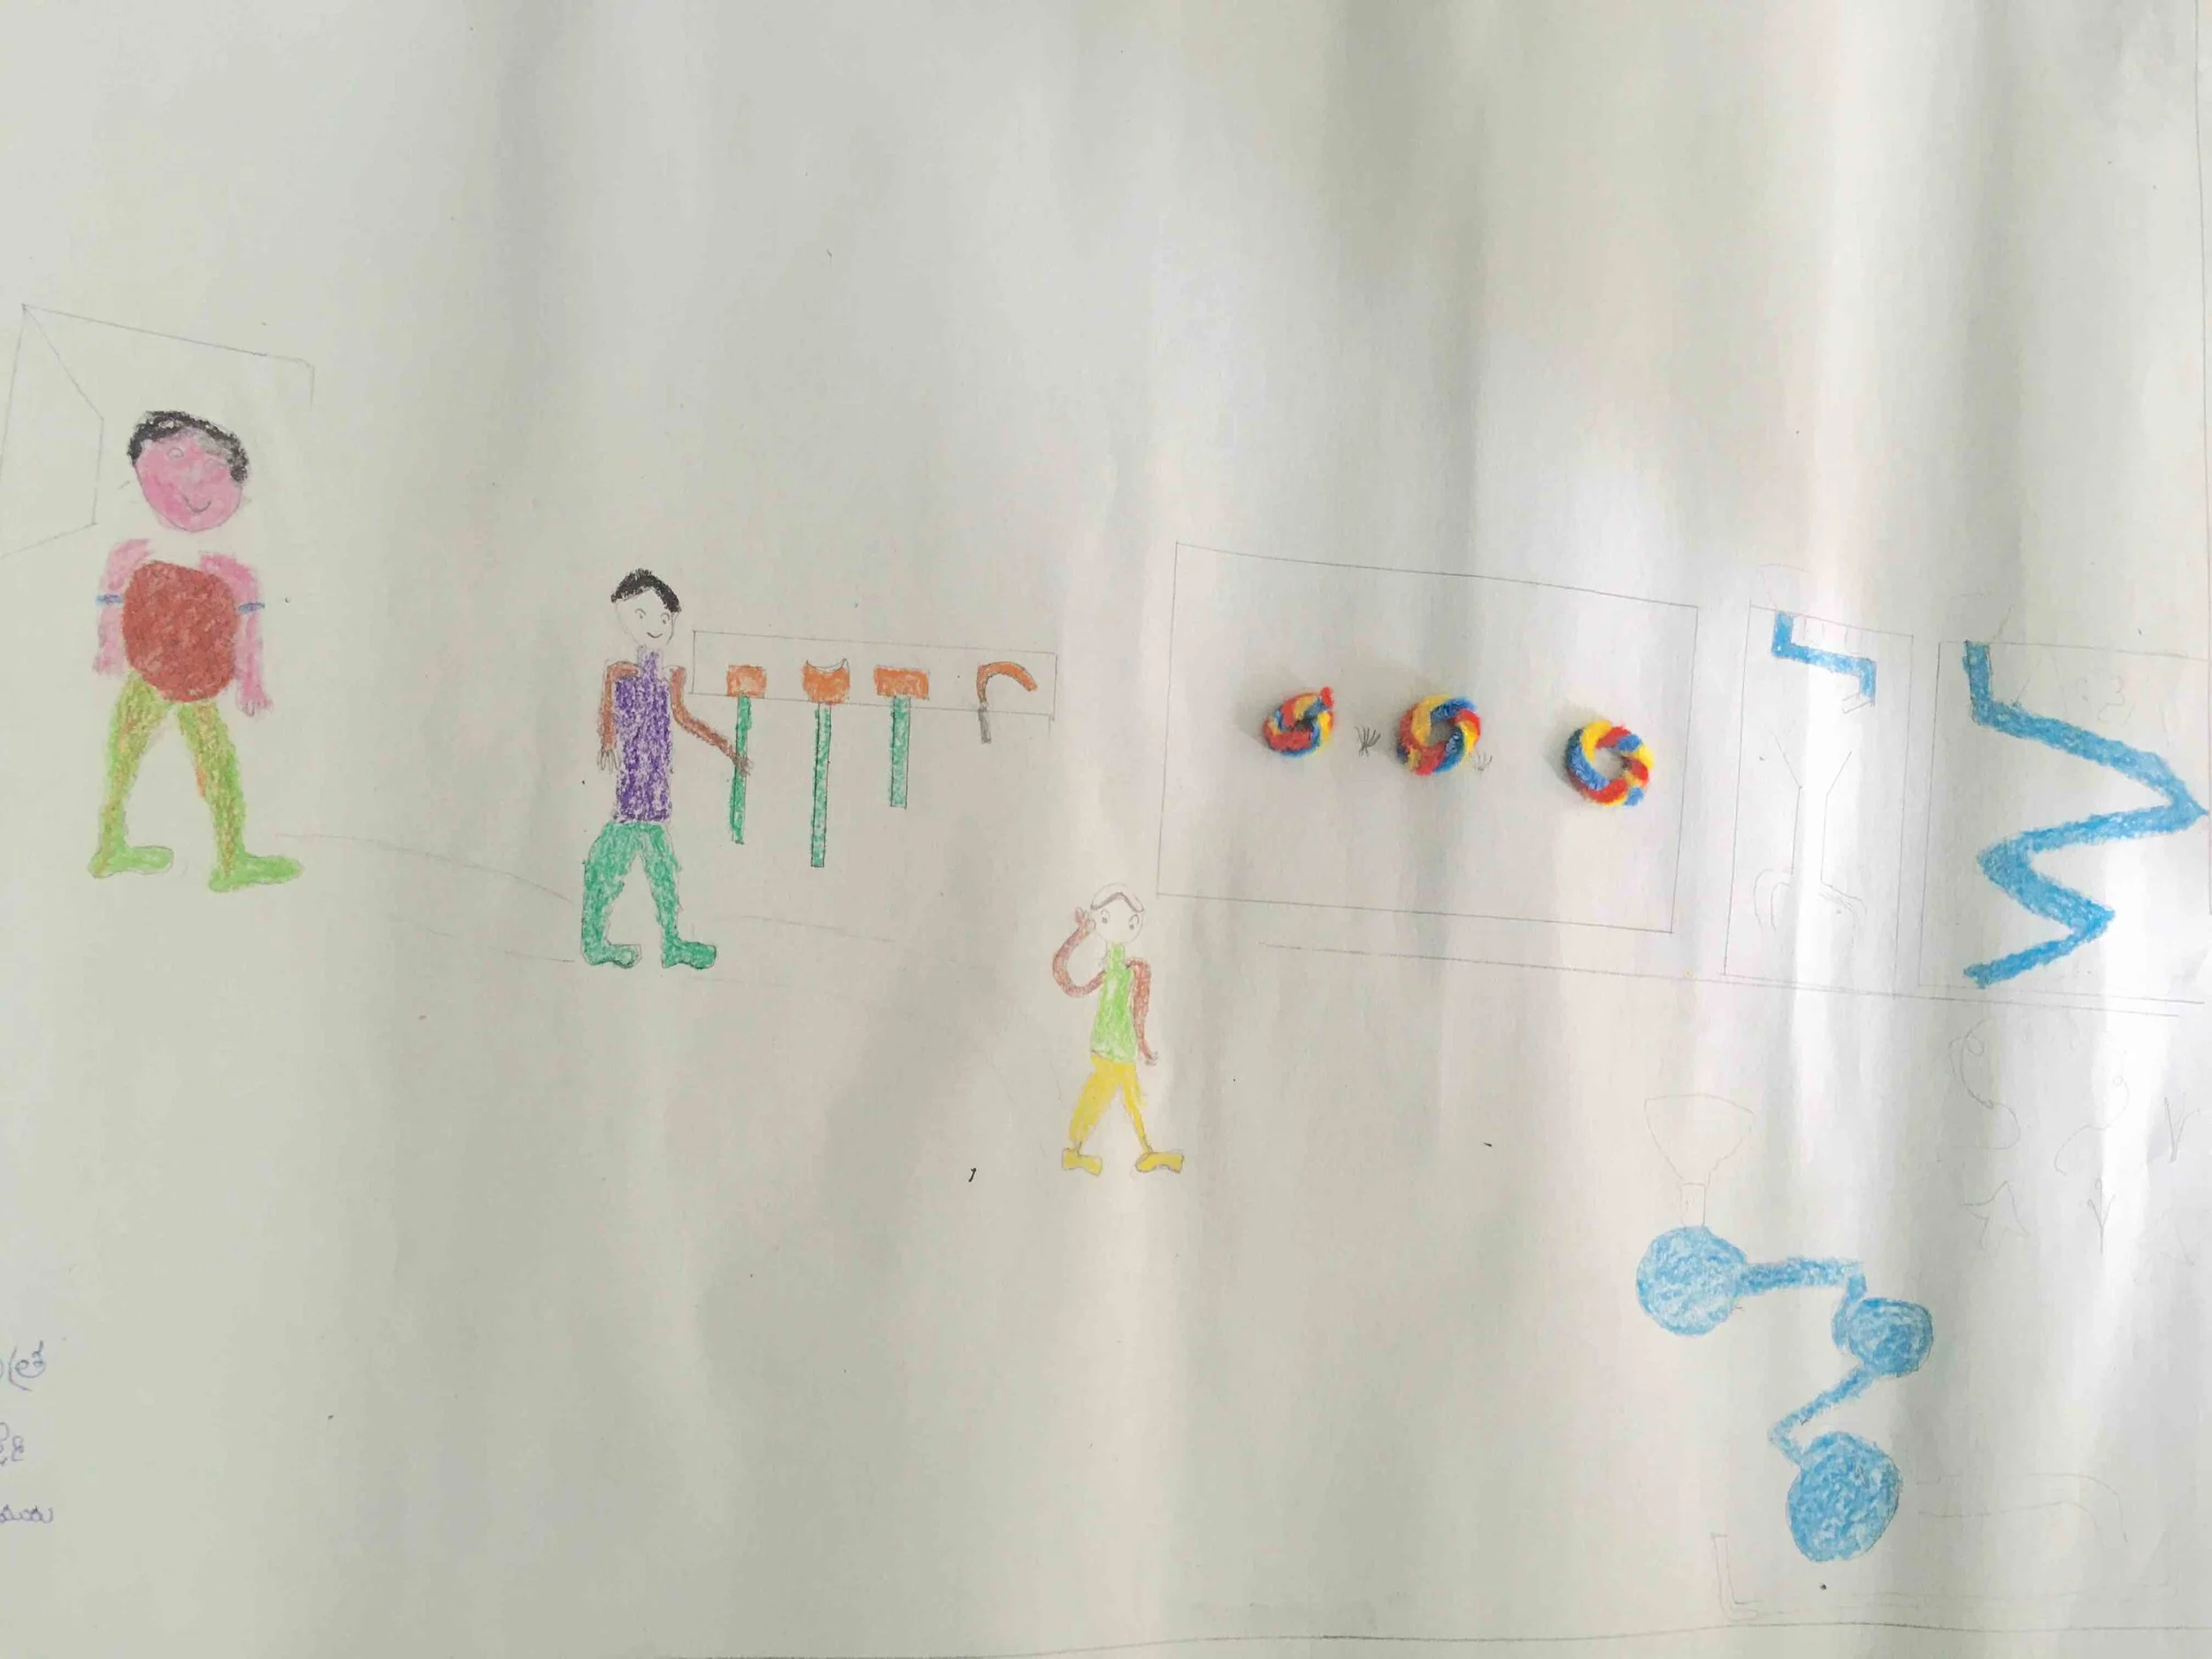

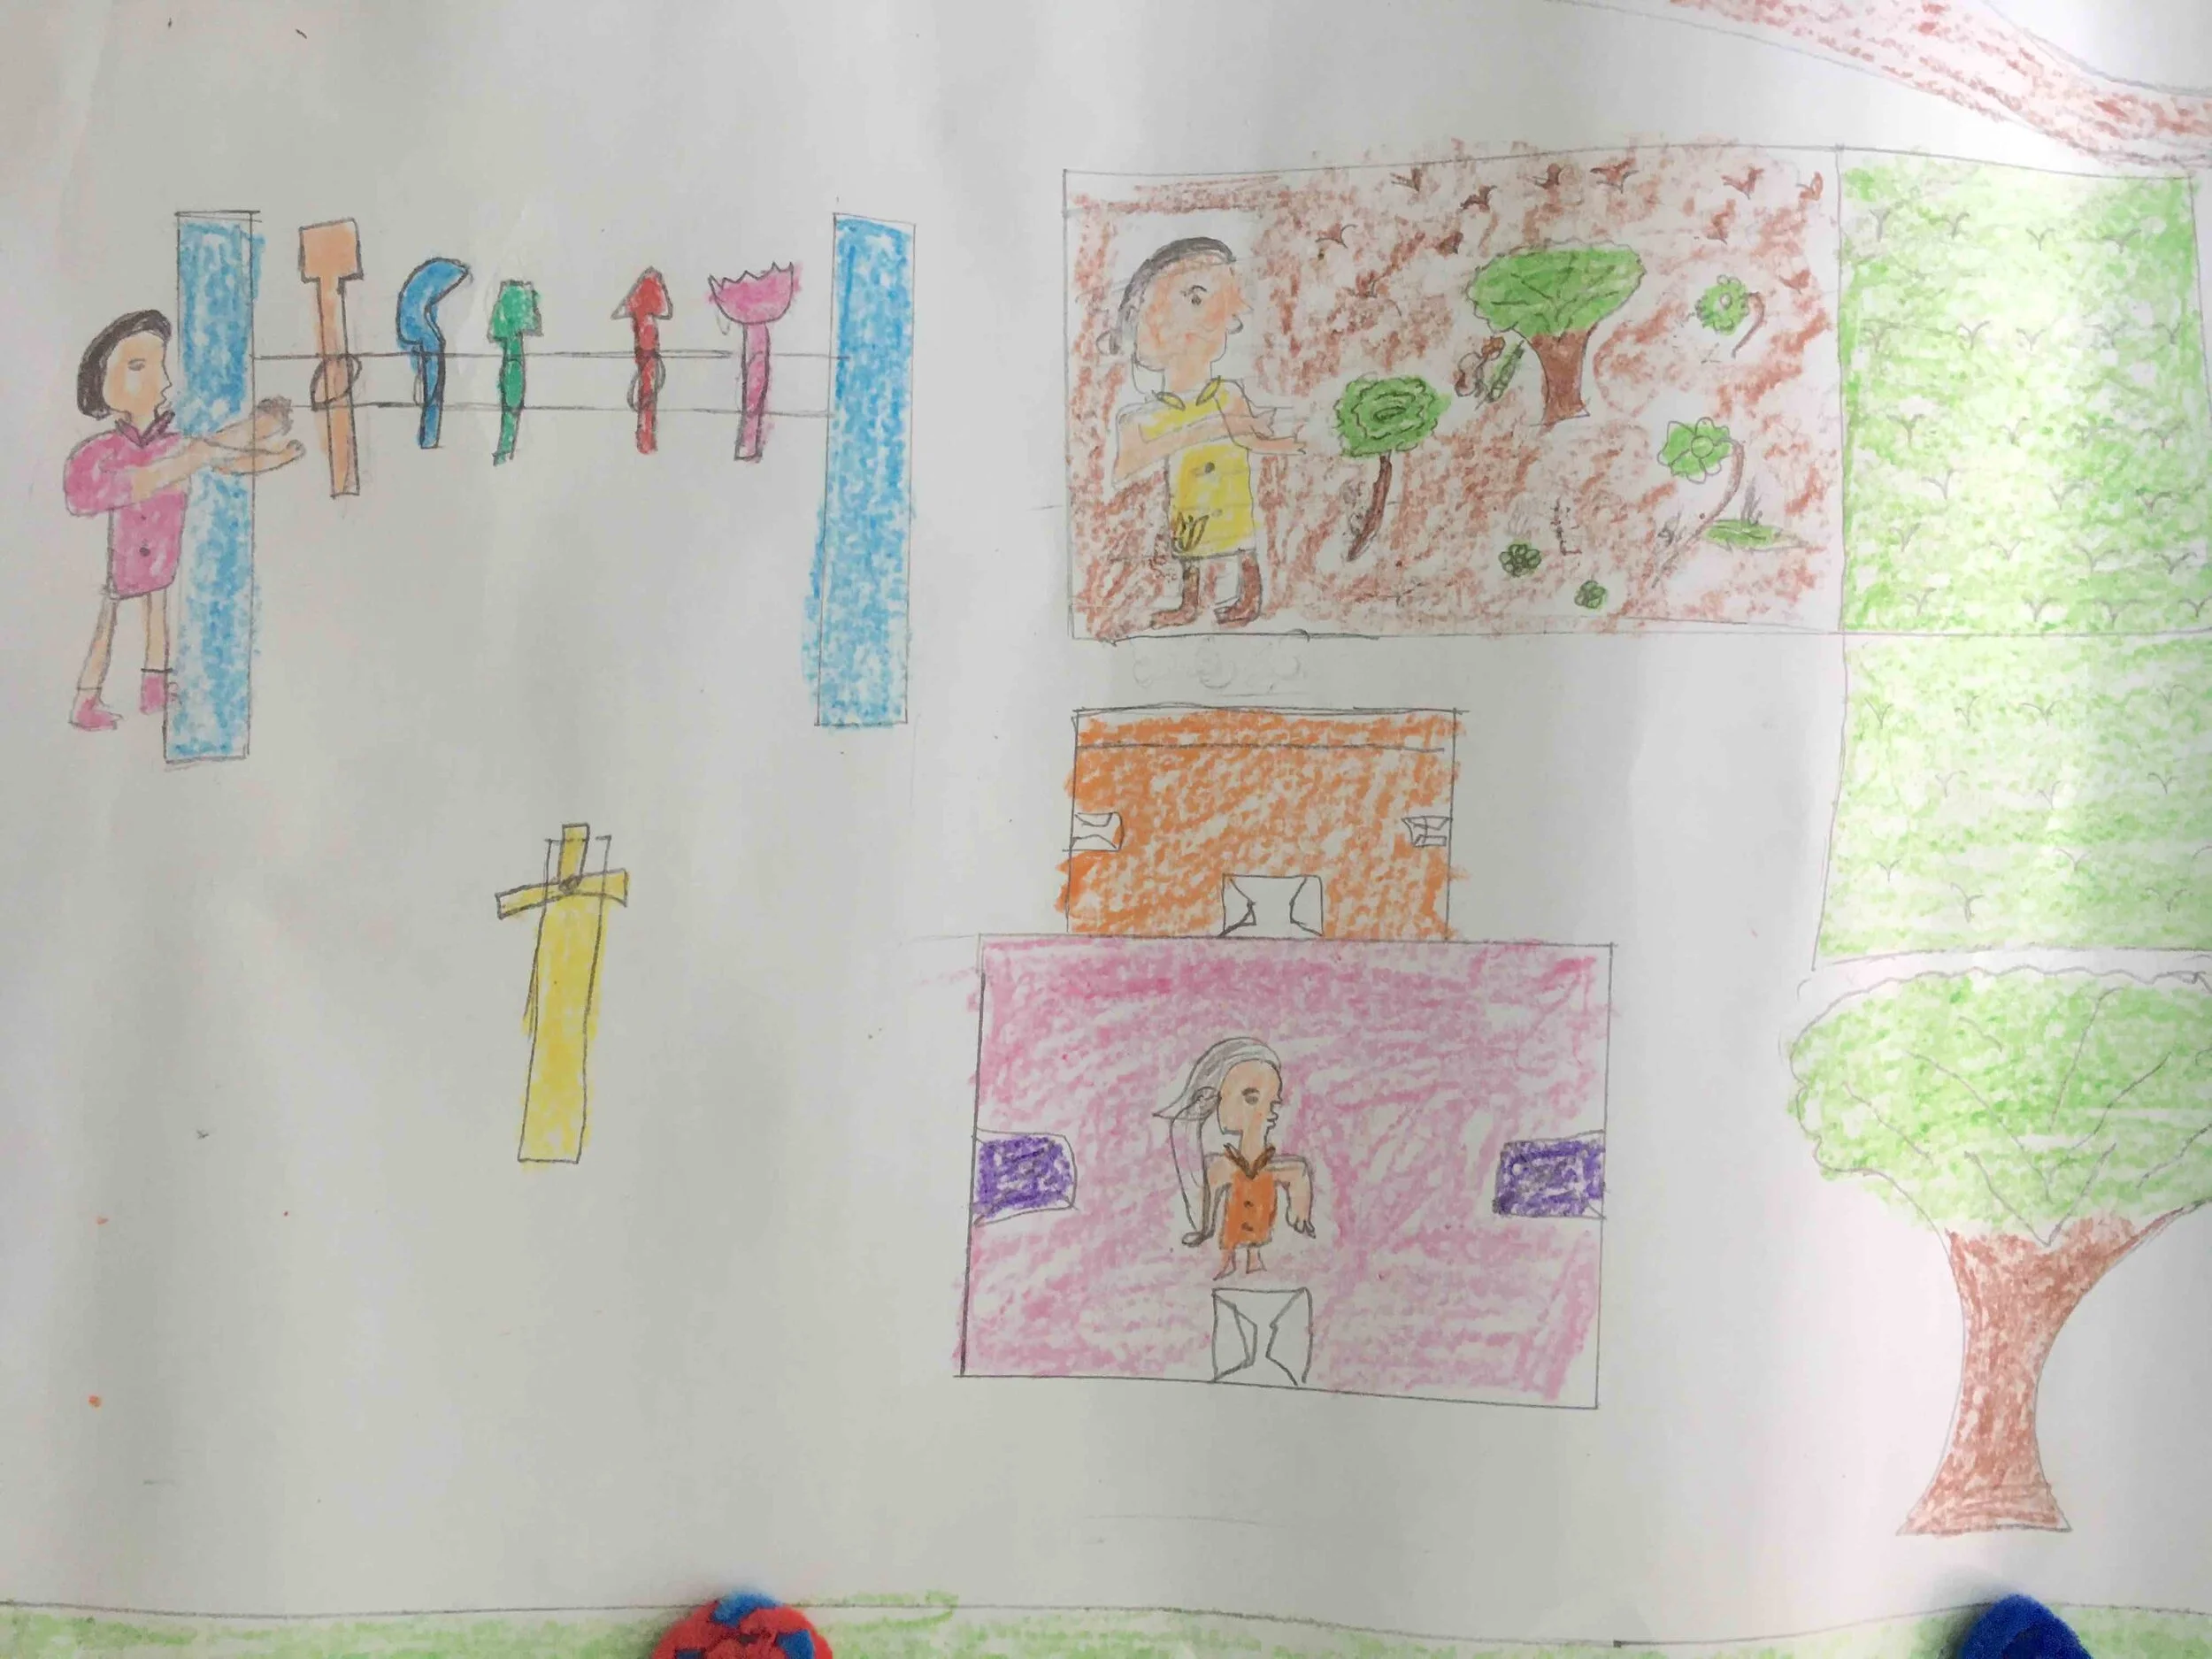


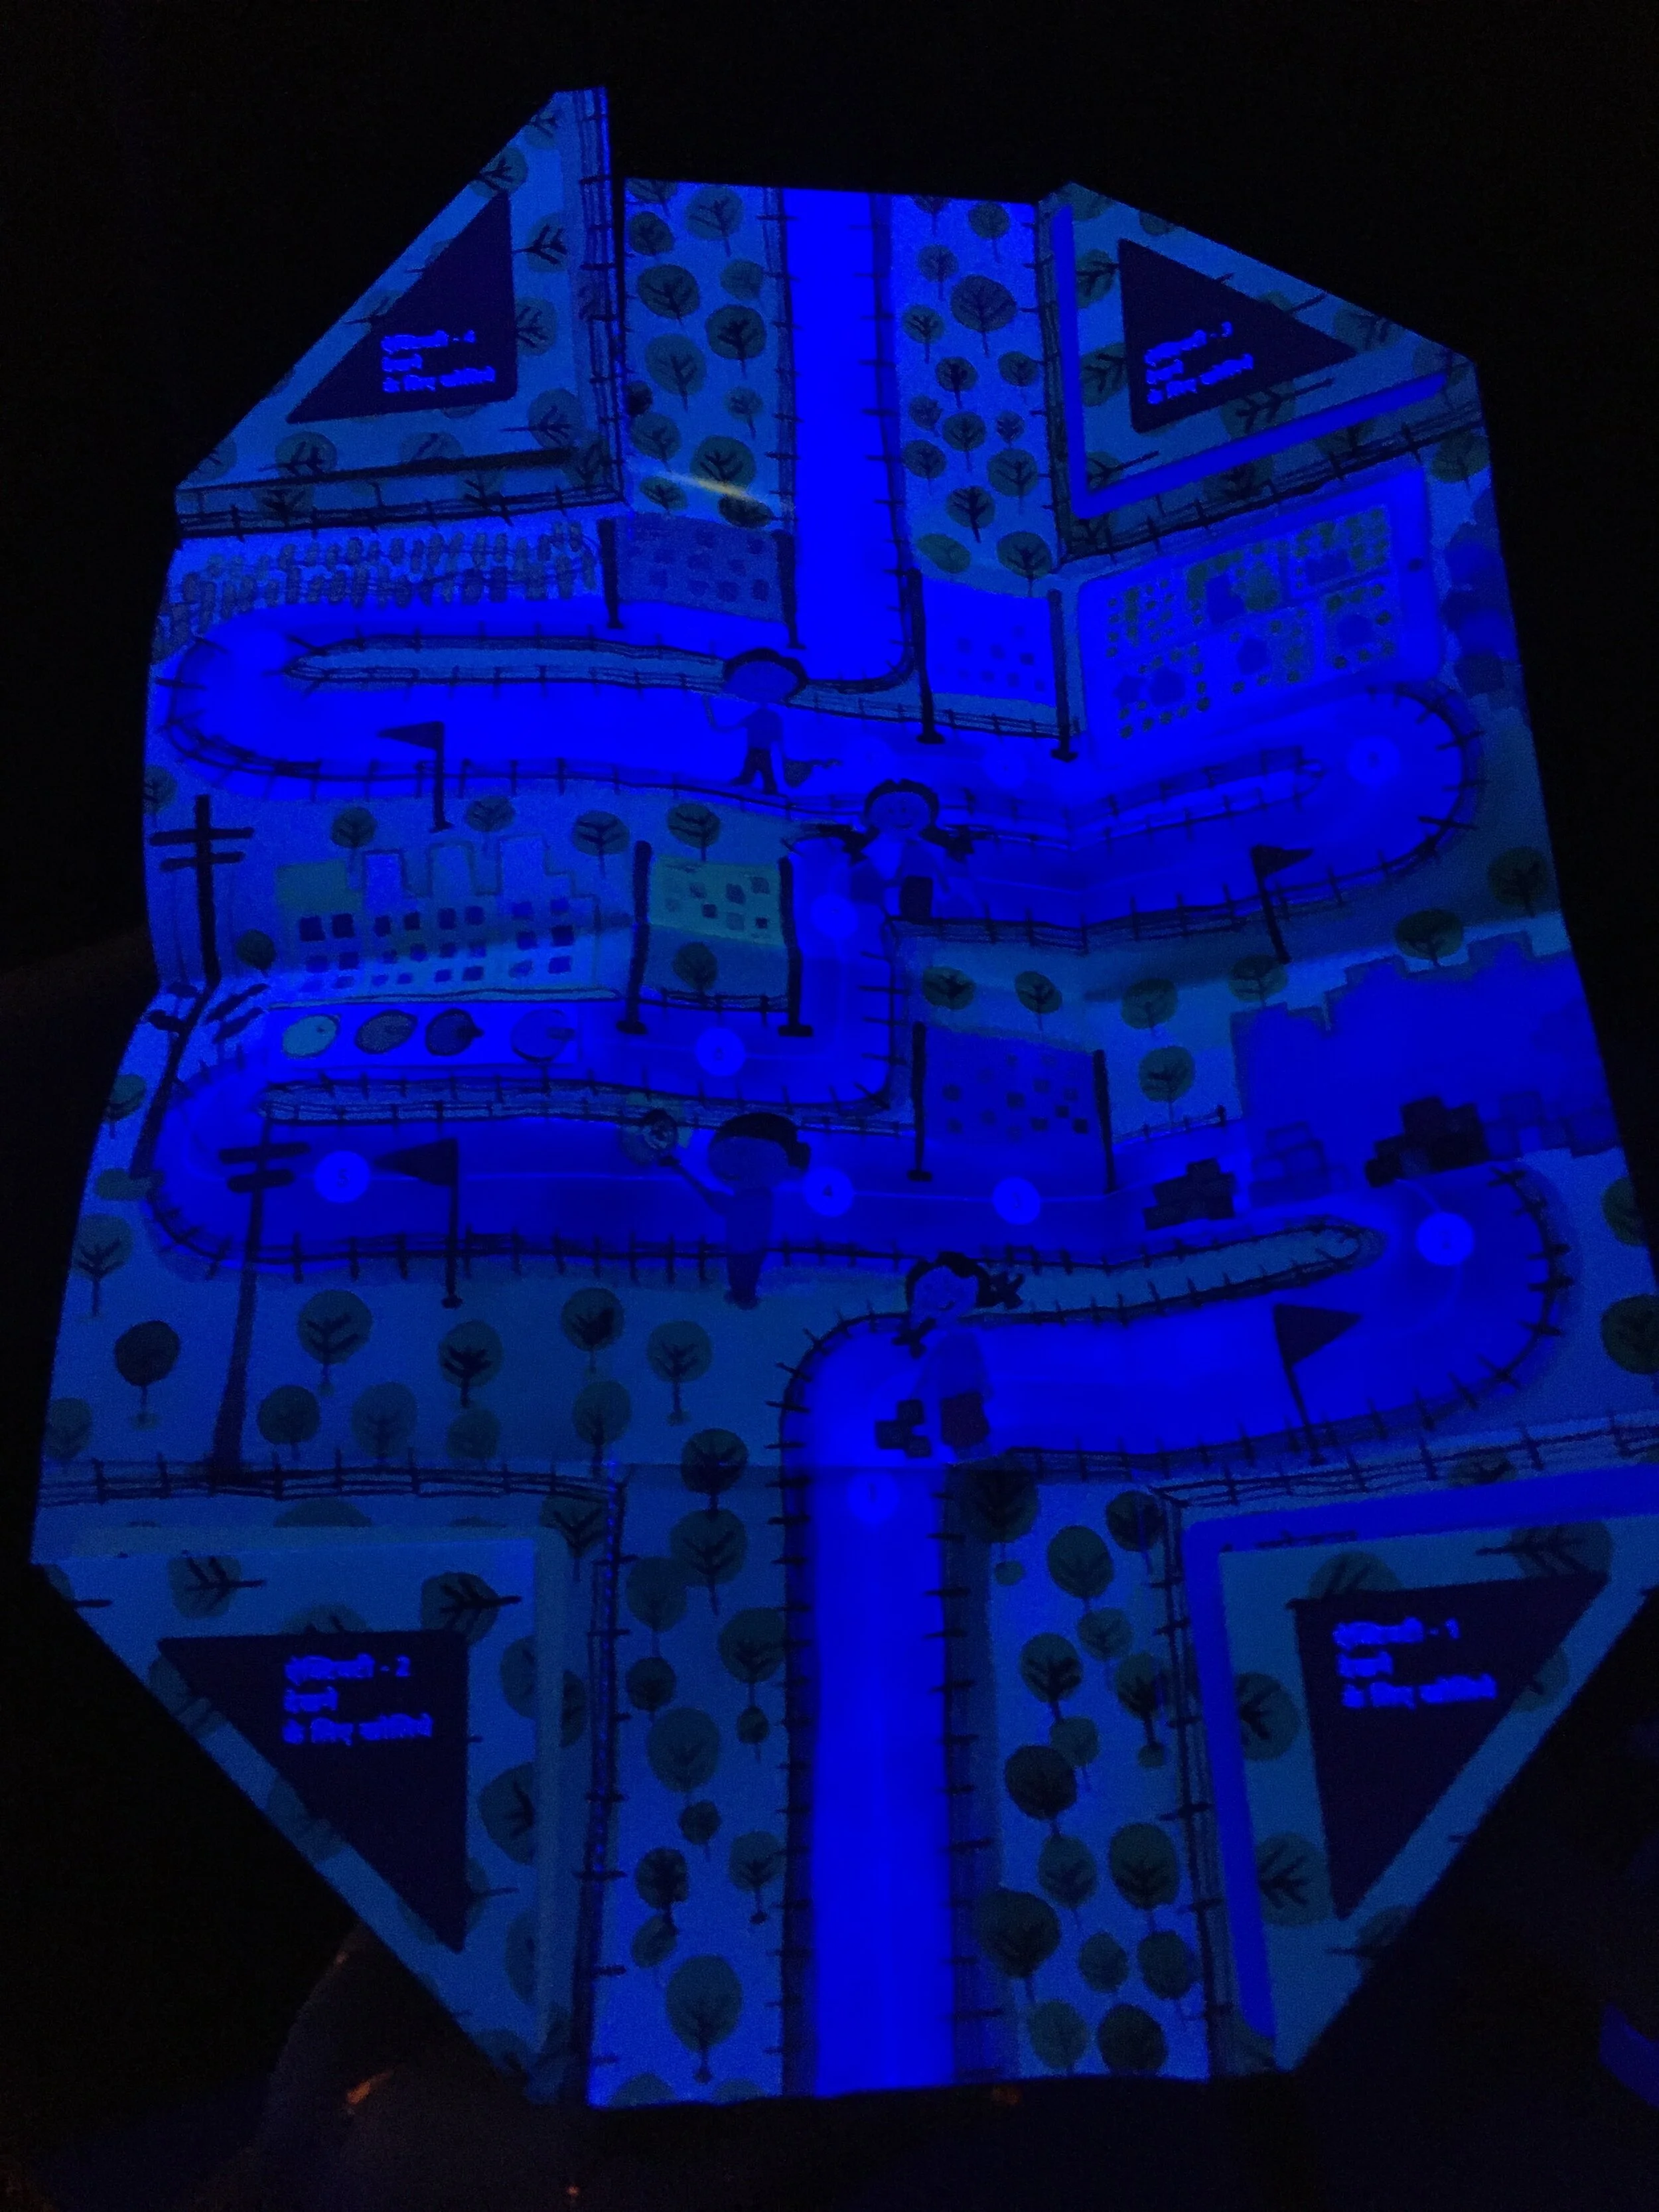
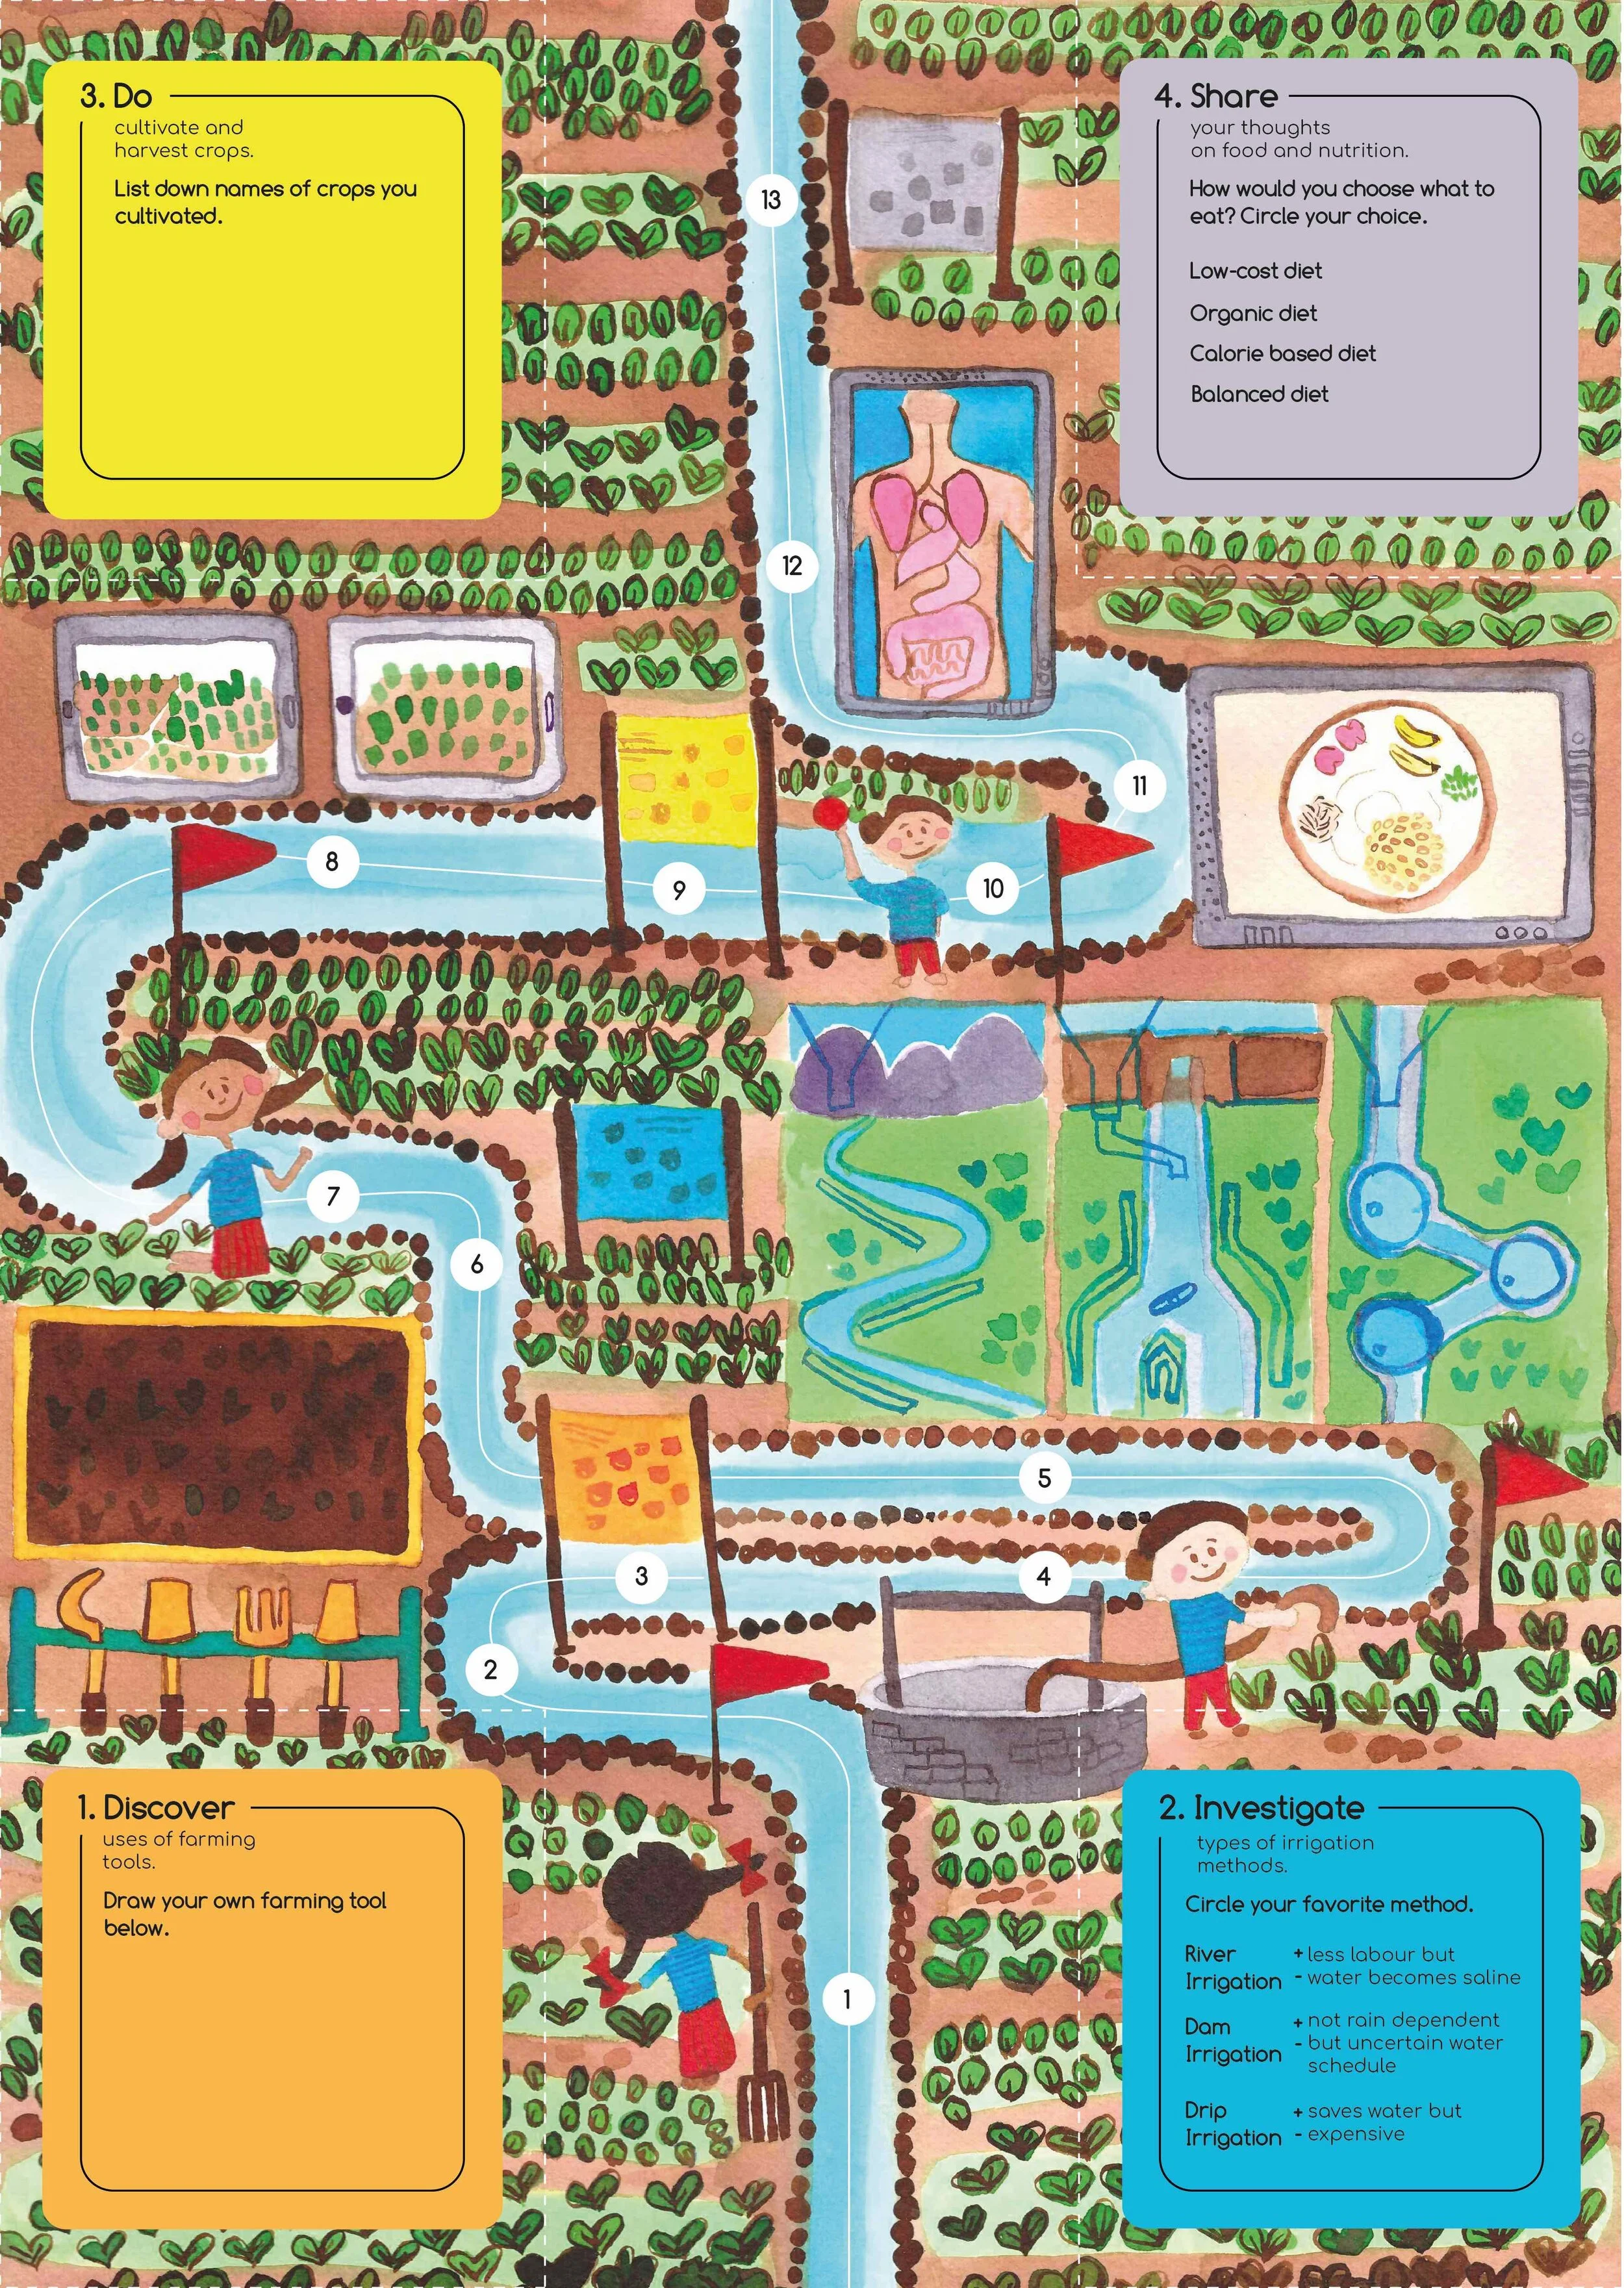
FINAL Map
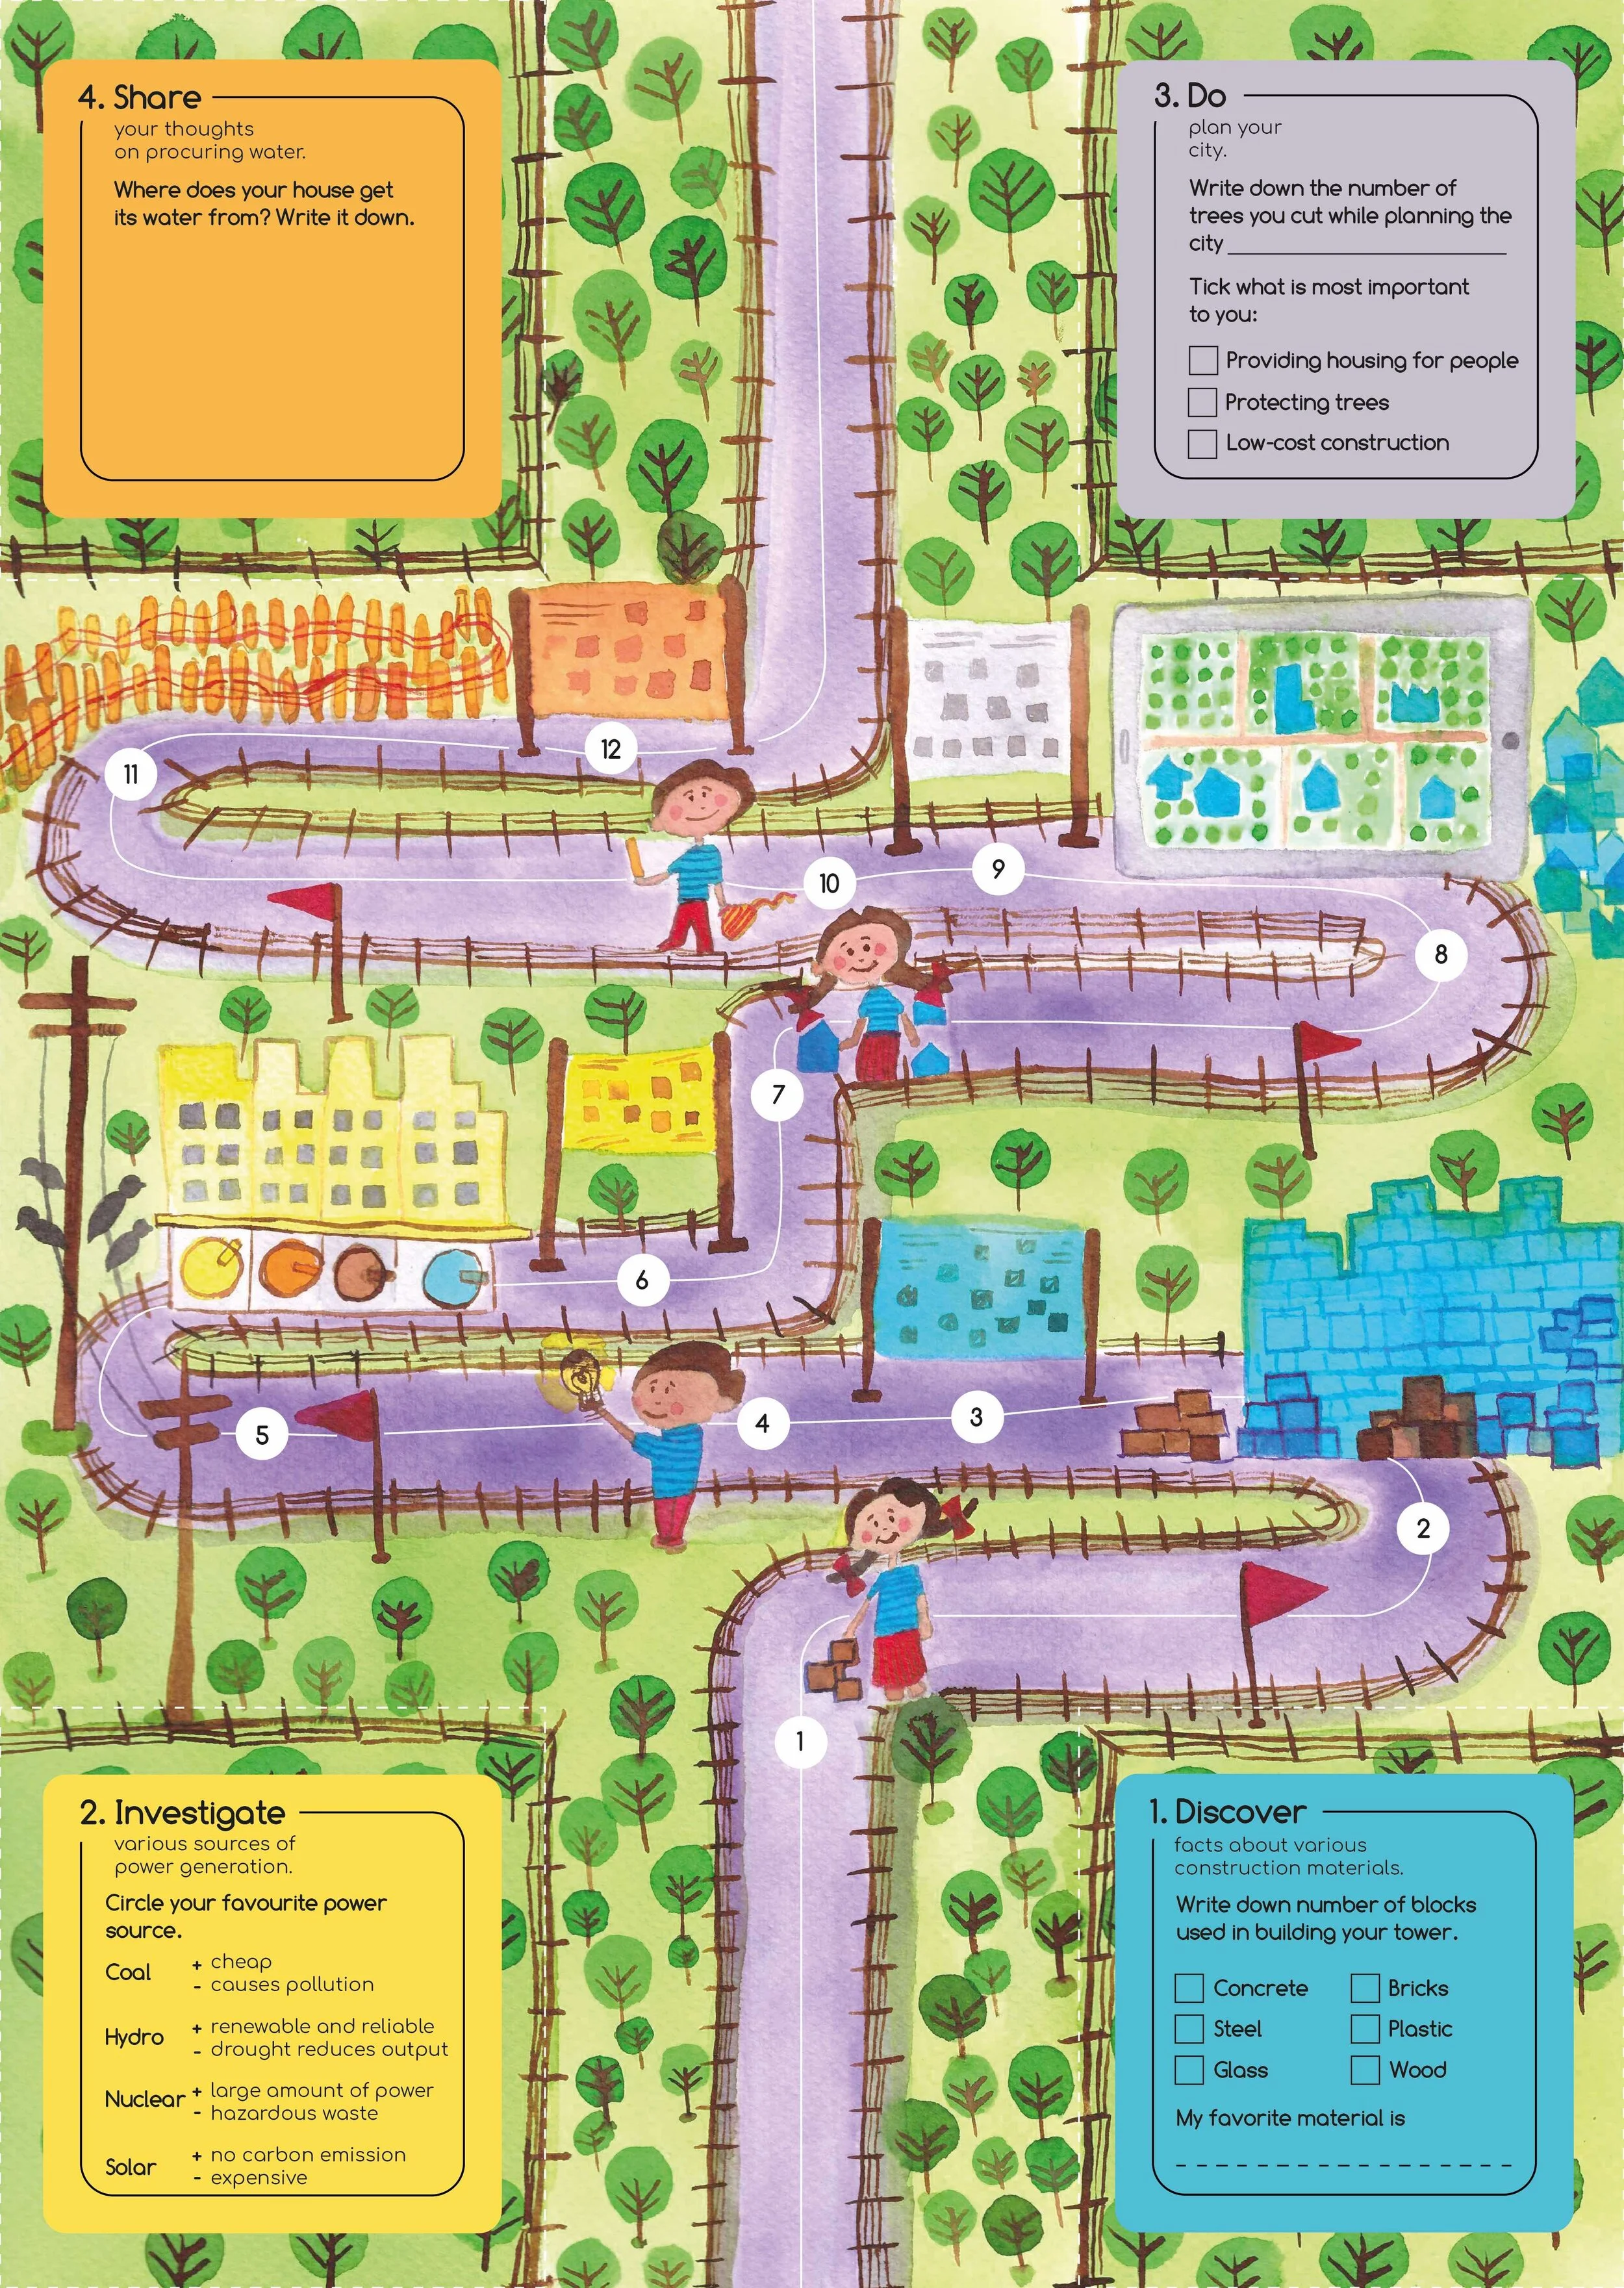
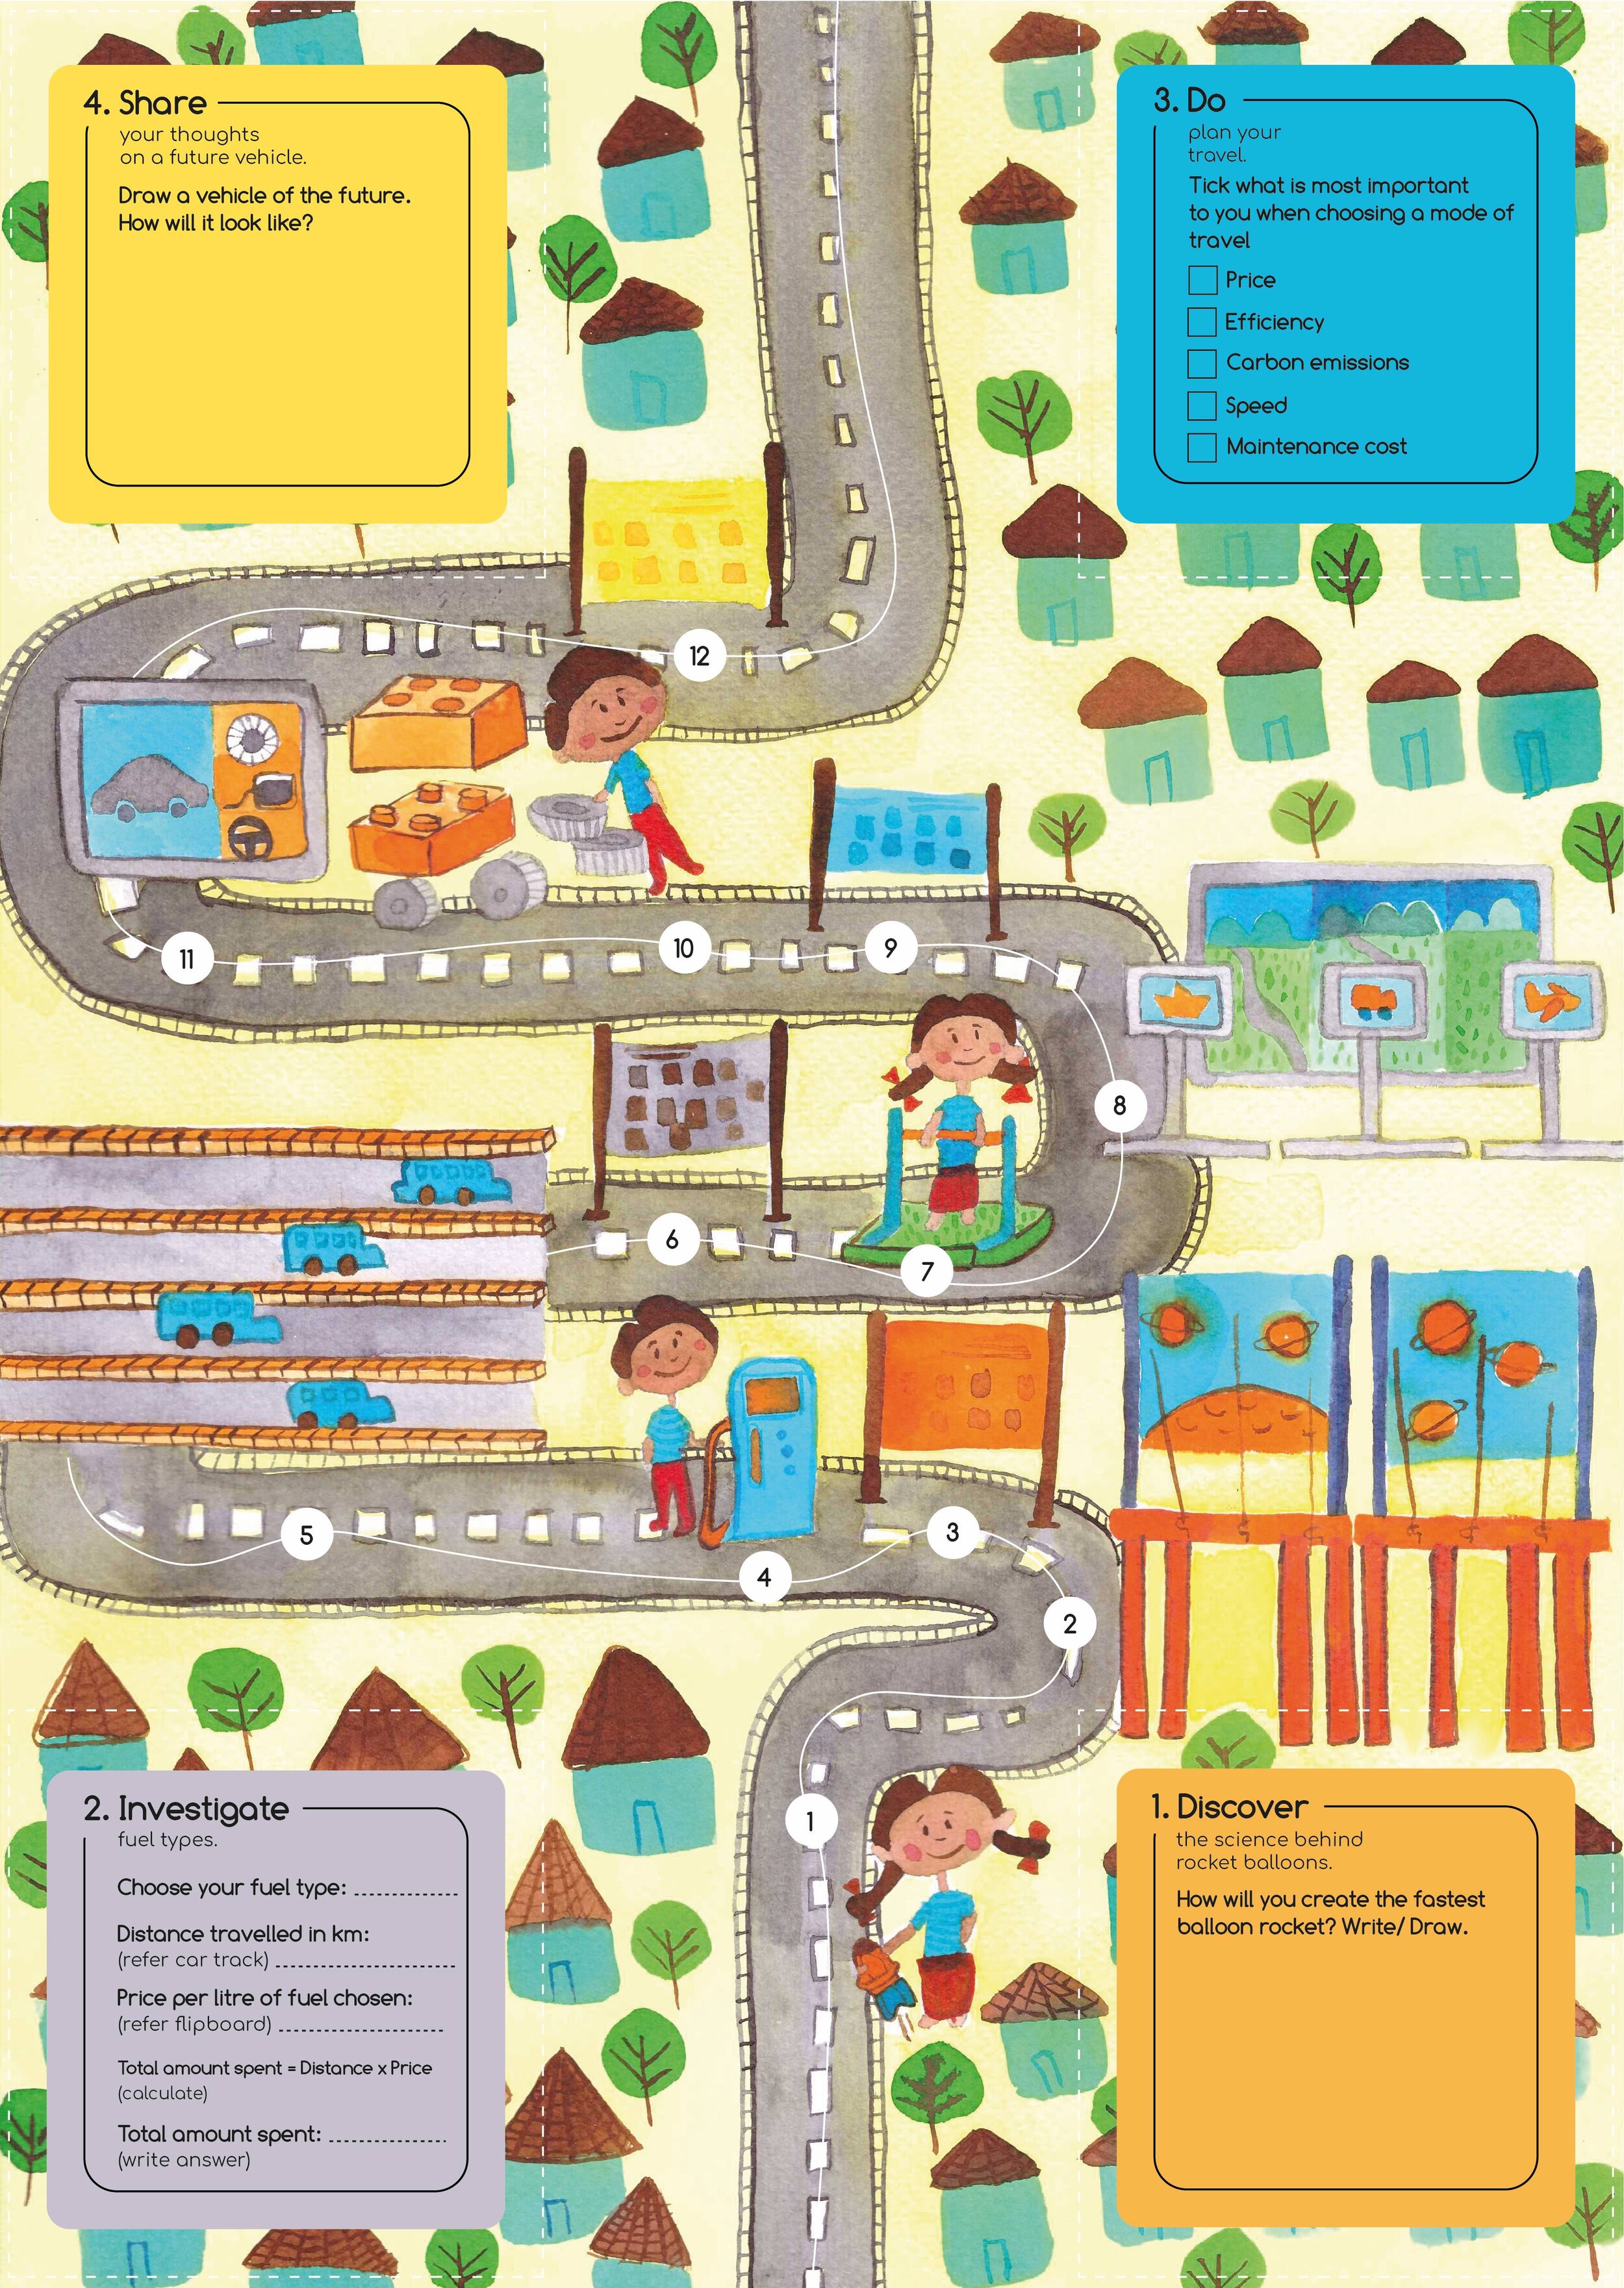
My revised take on the map: The illustration style is borrowed from the children’s representations, with the exhibits resembling the real-time hardware as on display, with characters built into the narrative, with pitstops being numbered and marked so kids can follow it sequentially. As and when kids reach a pitstop, they are required to colour-in the circles. The activity cards are positioned in the map corners and will be perforated so they can be easily torn off. These maps are illustrated by hand using photo colours and were worked on digitally in Adobe Illustrator.

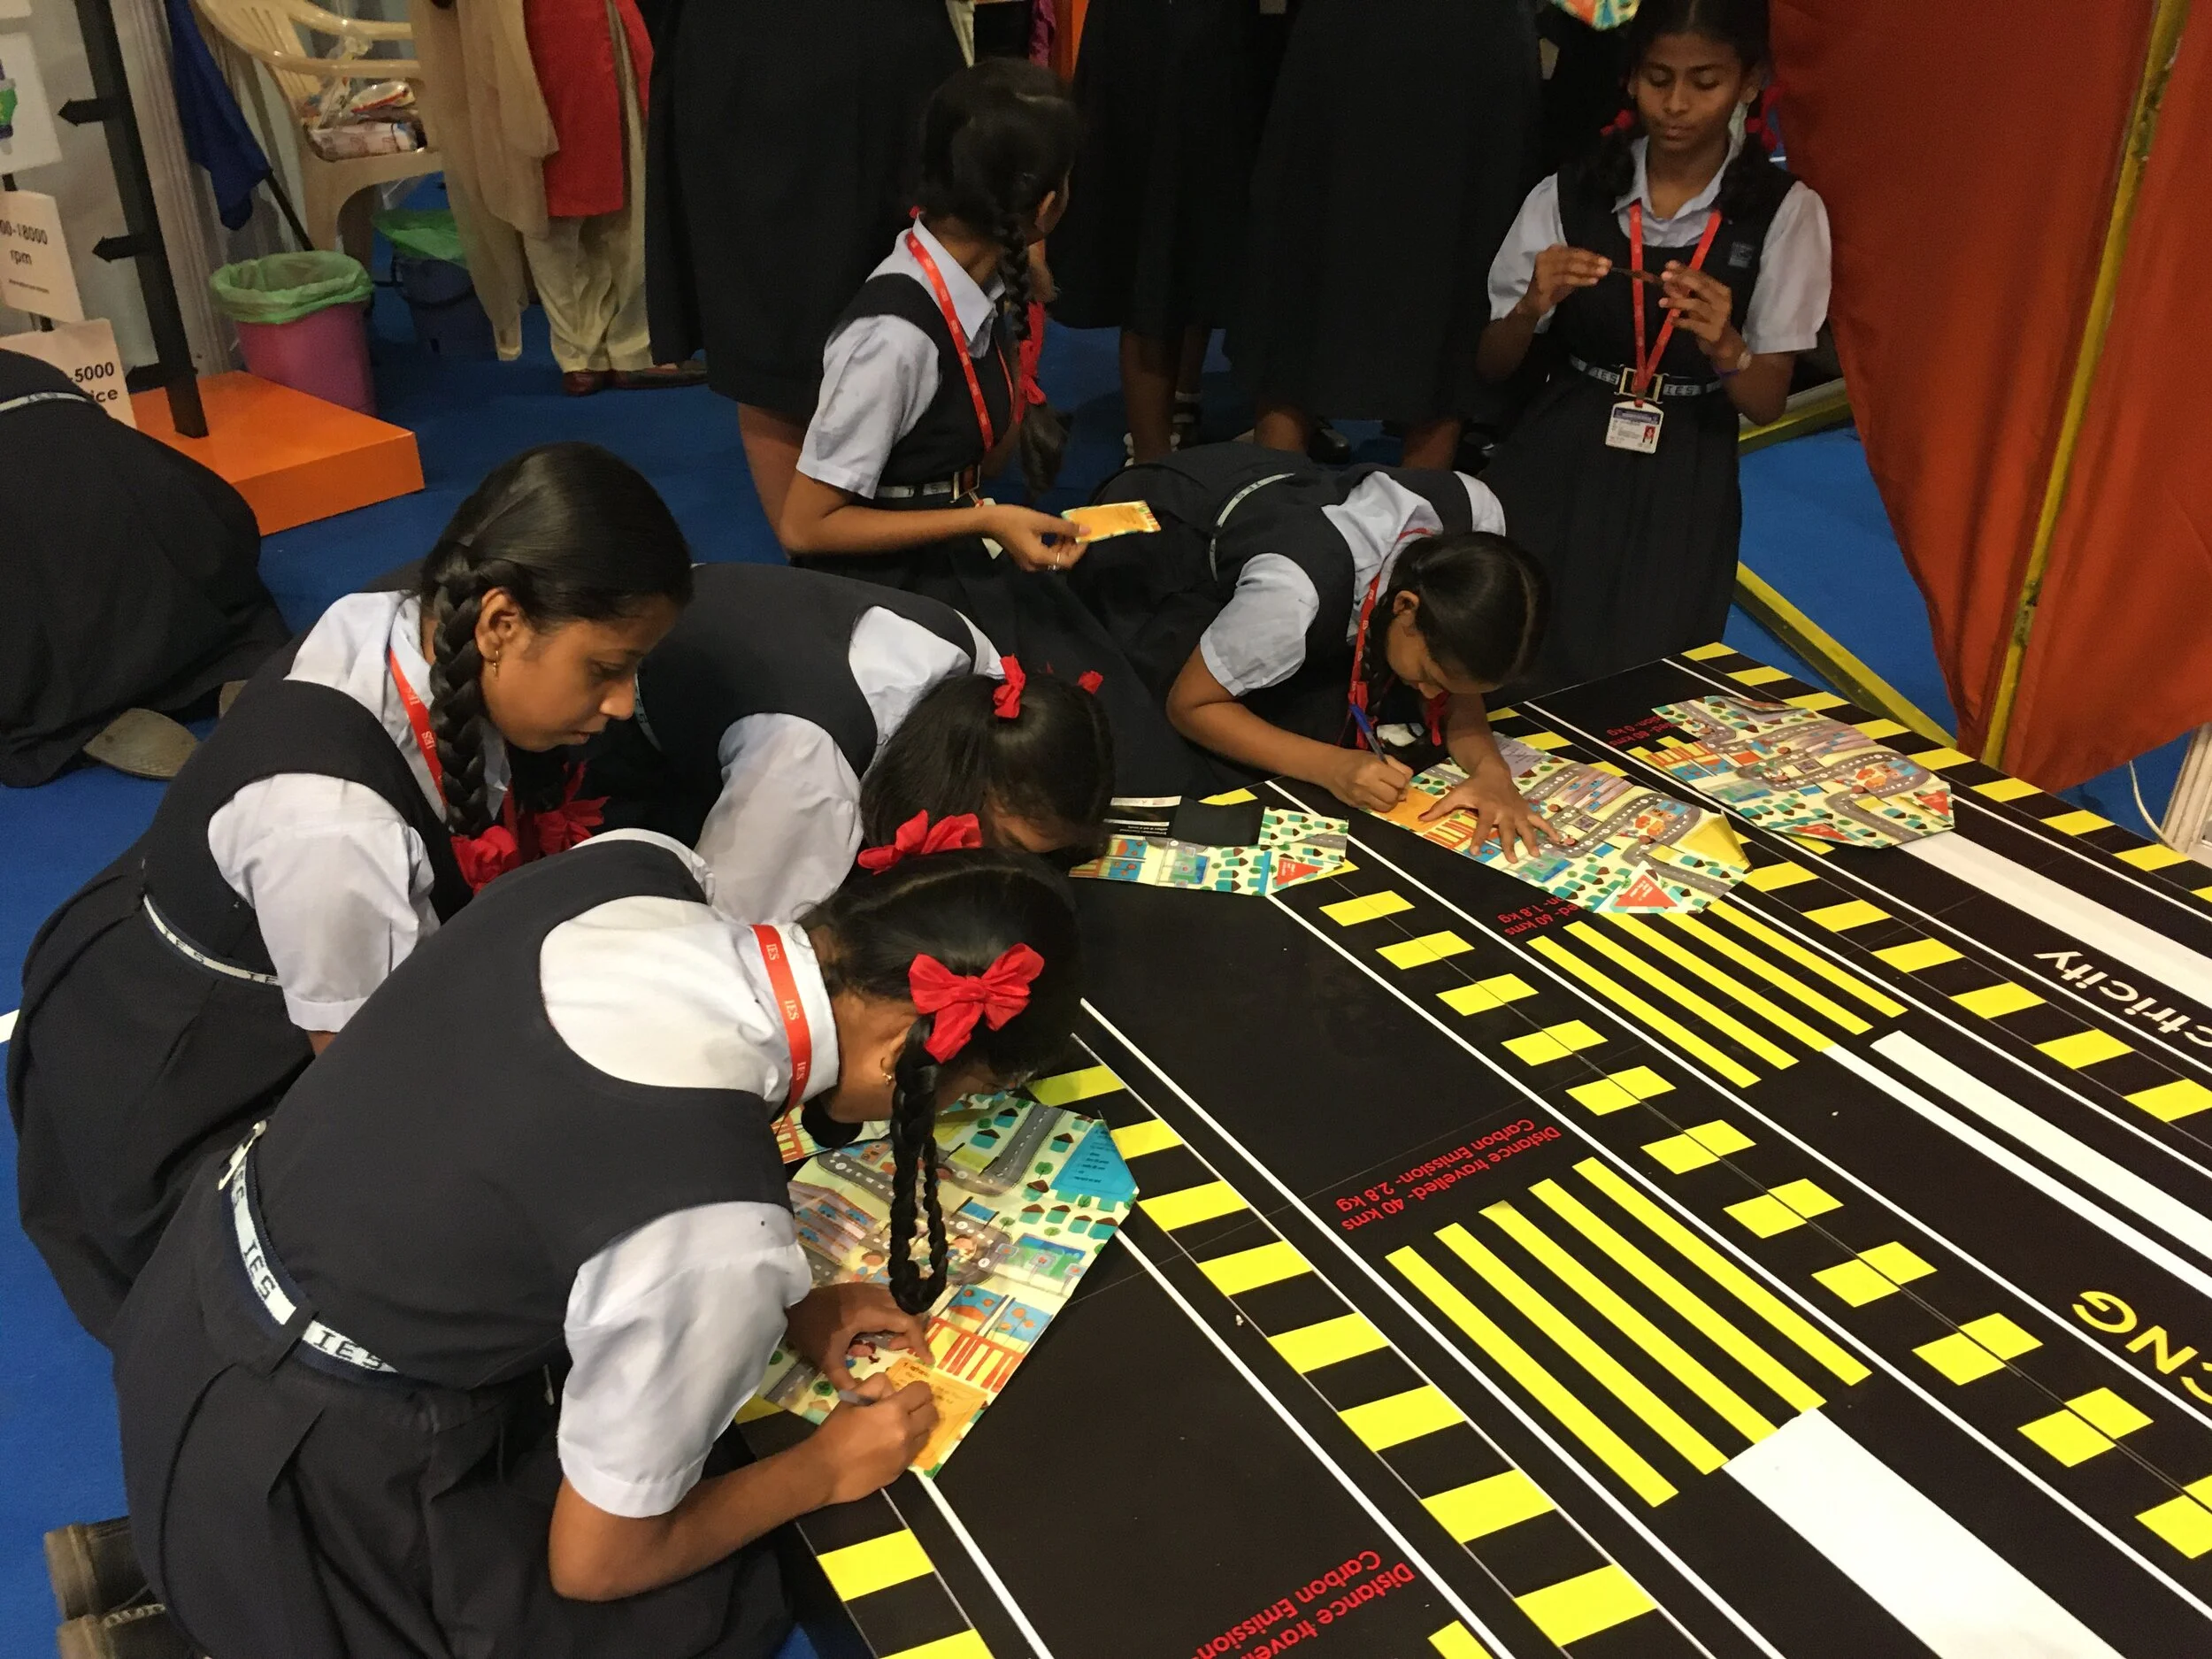
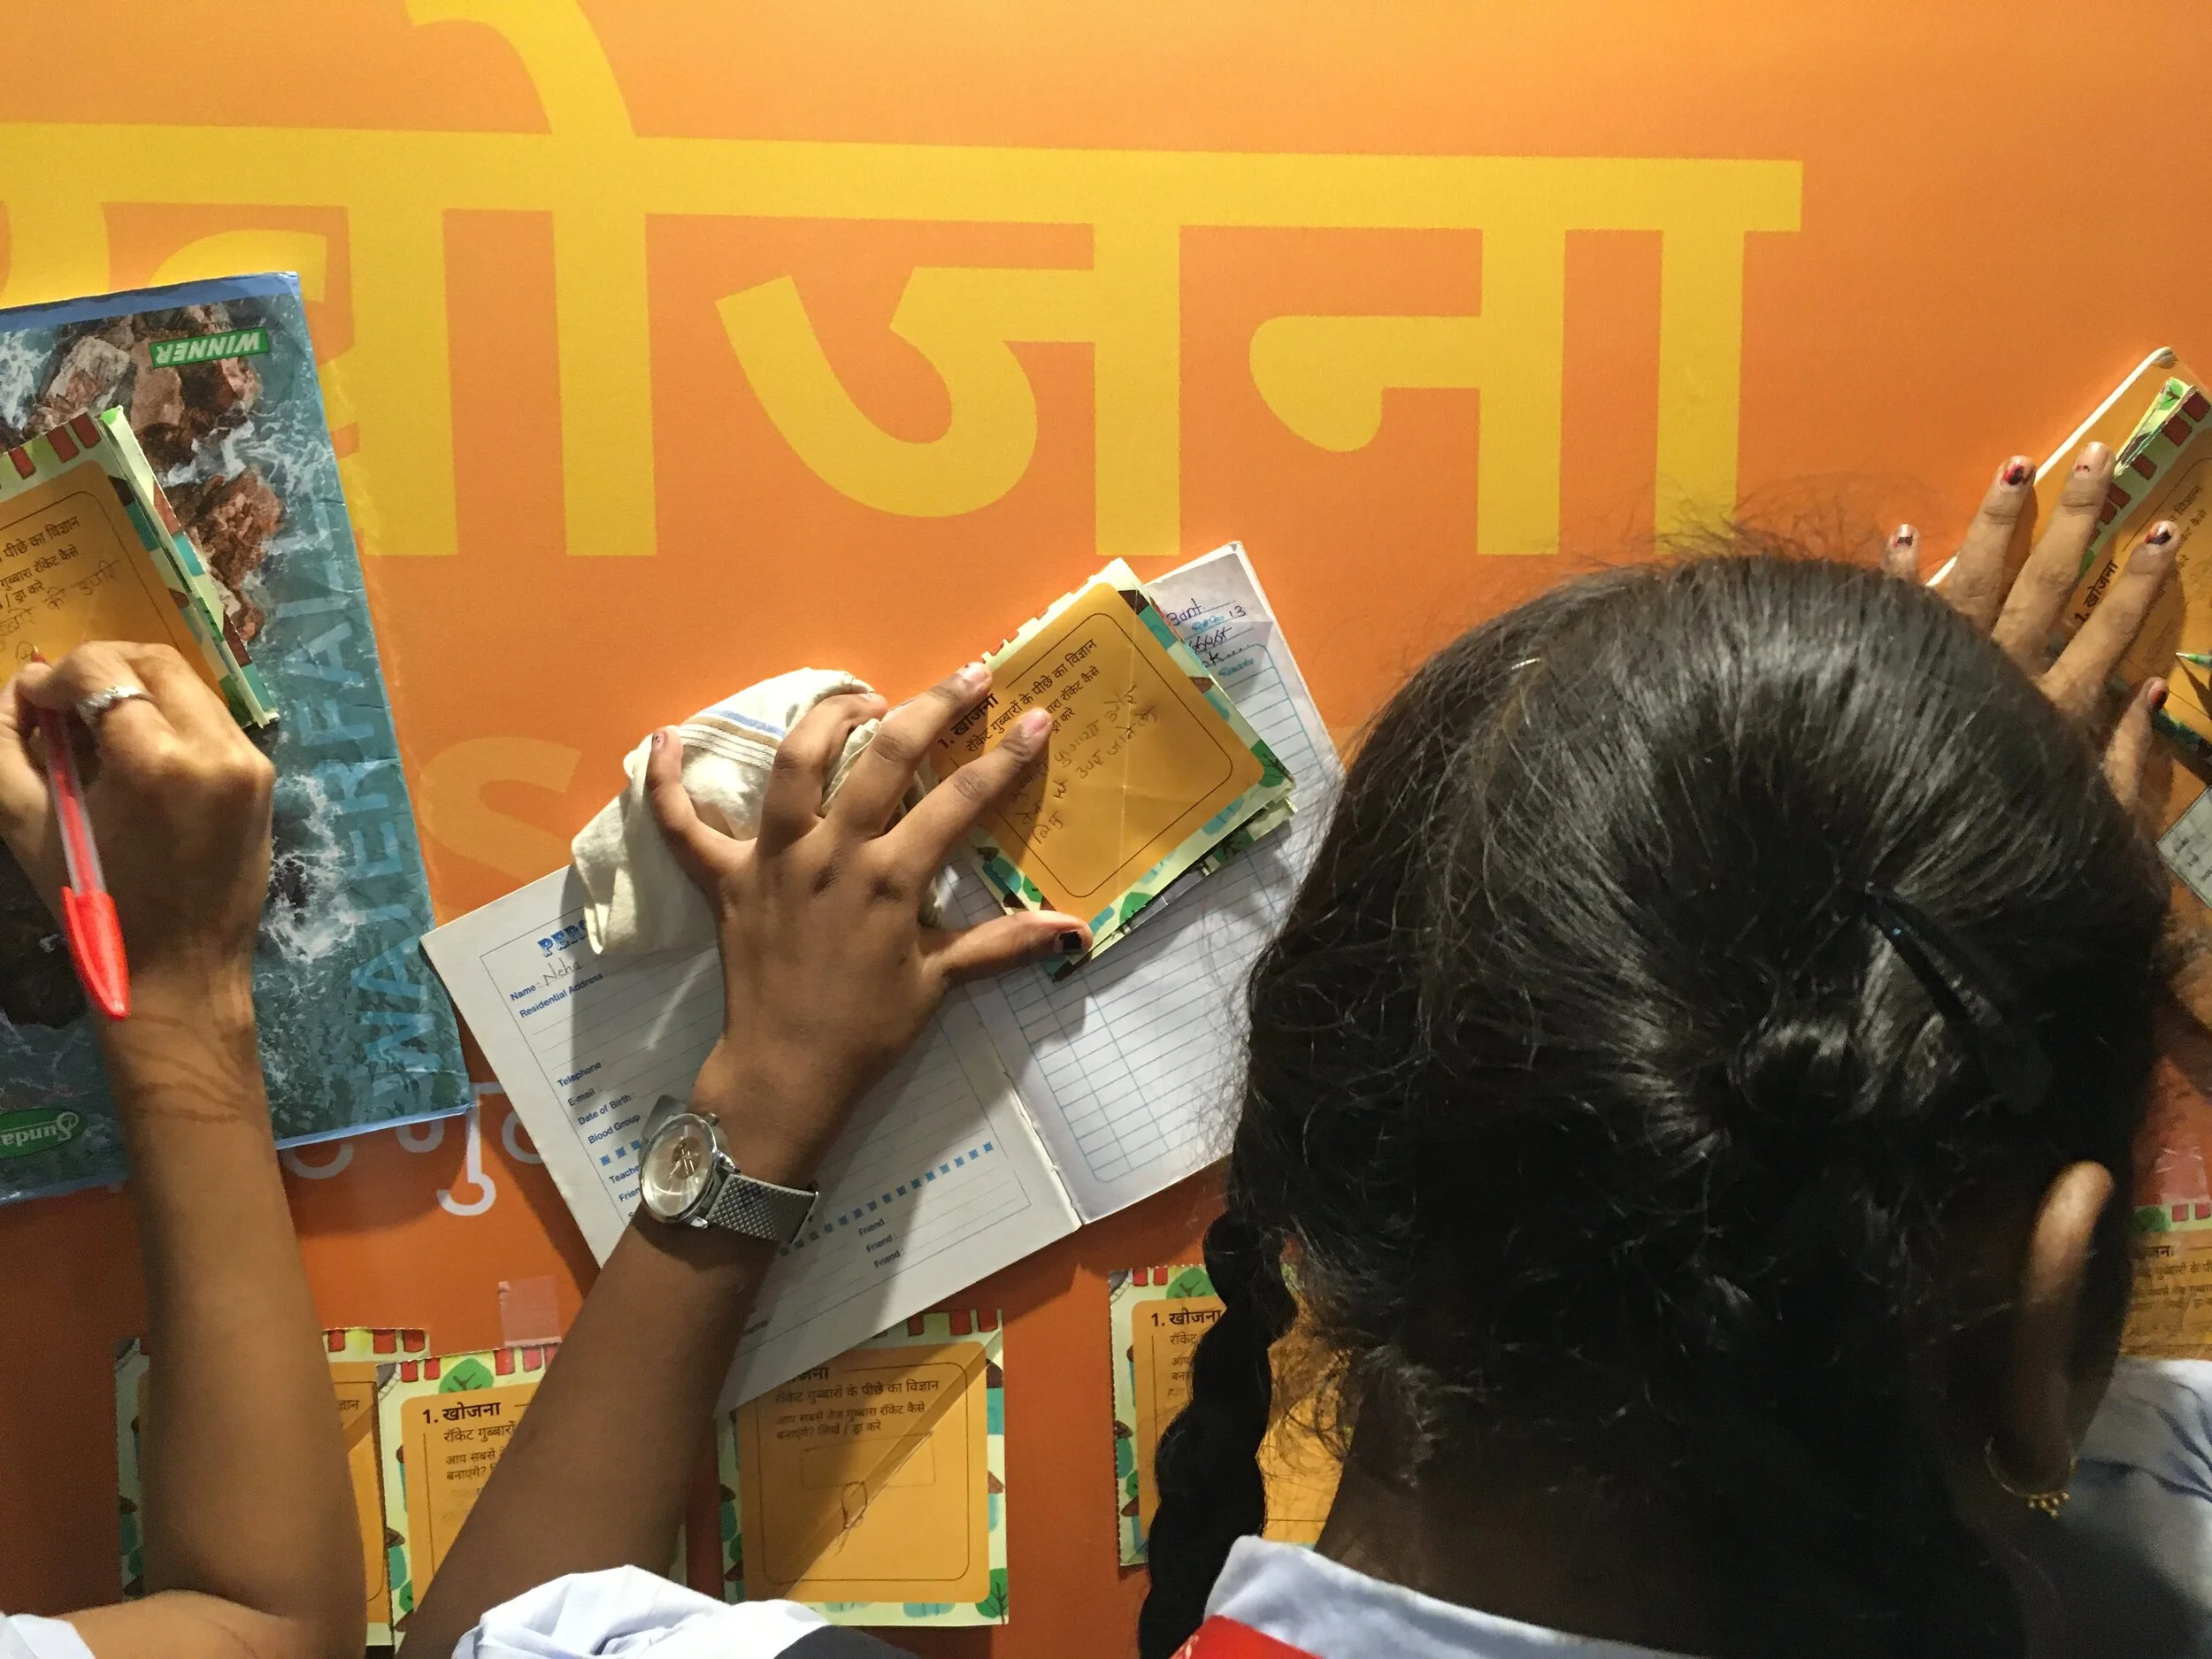
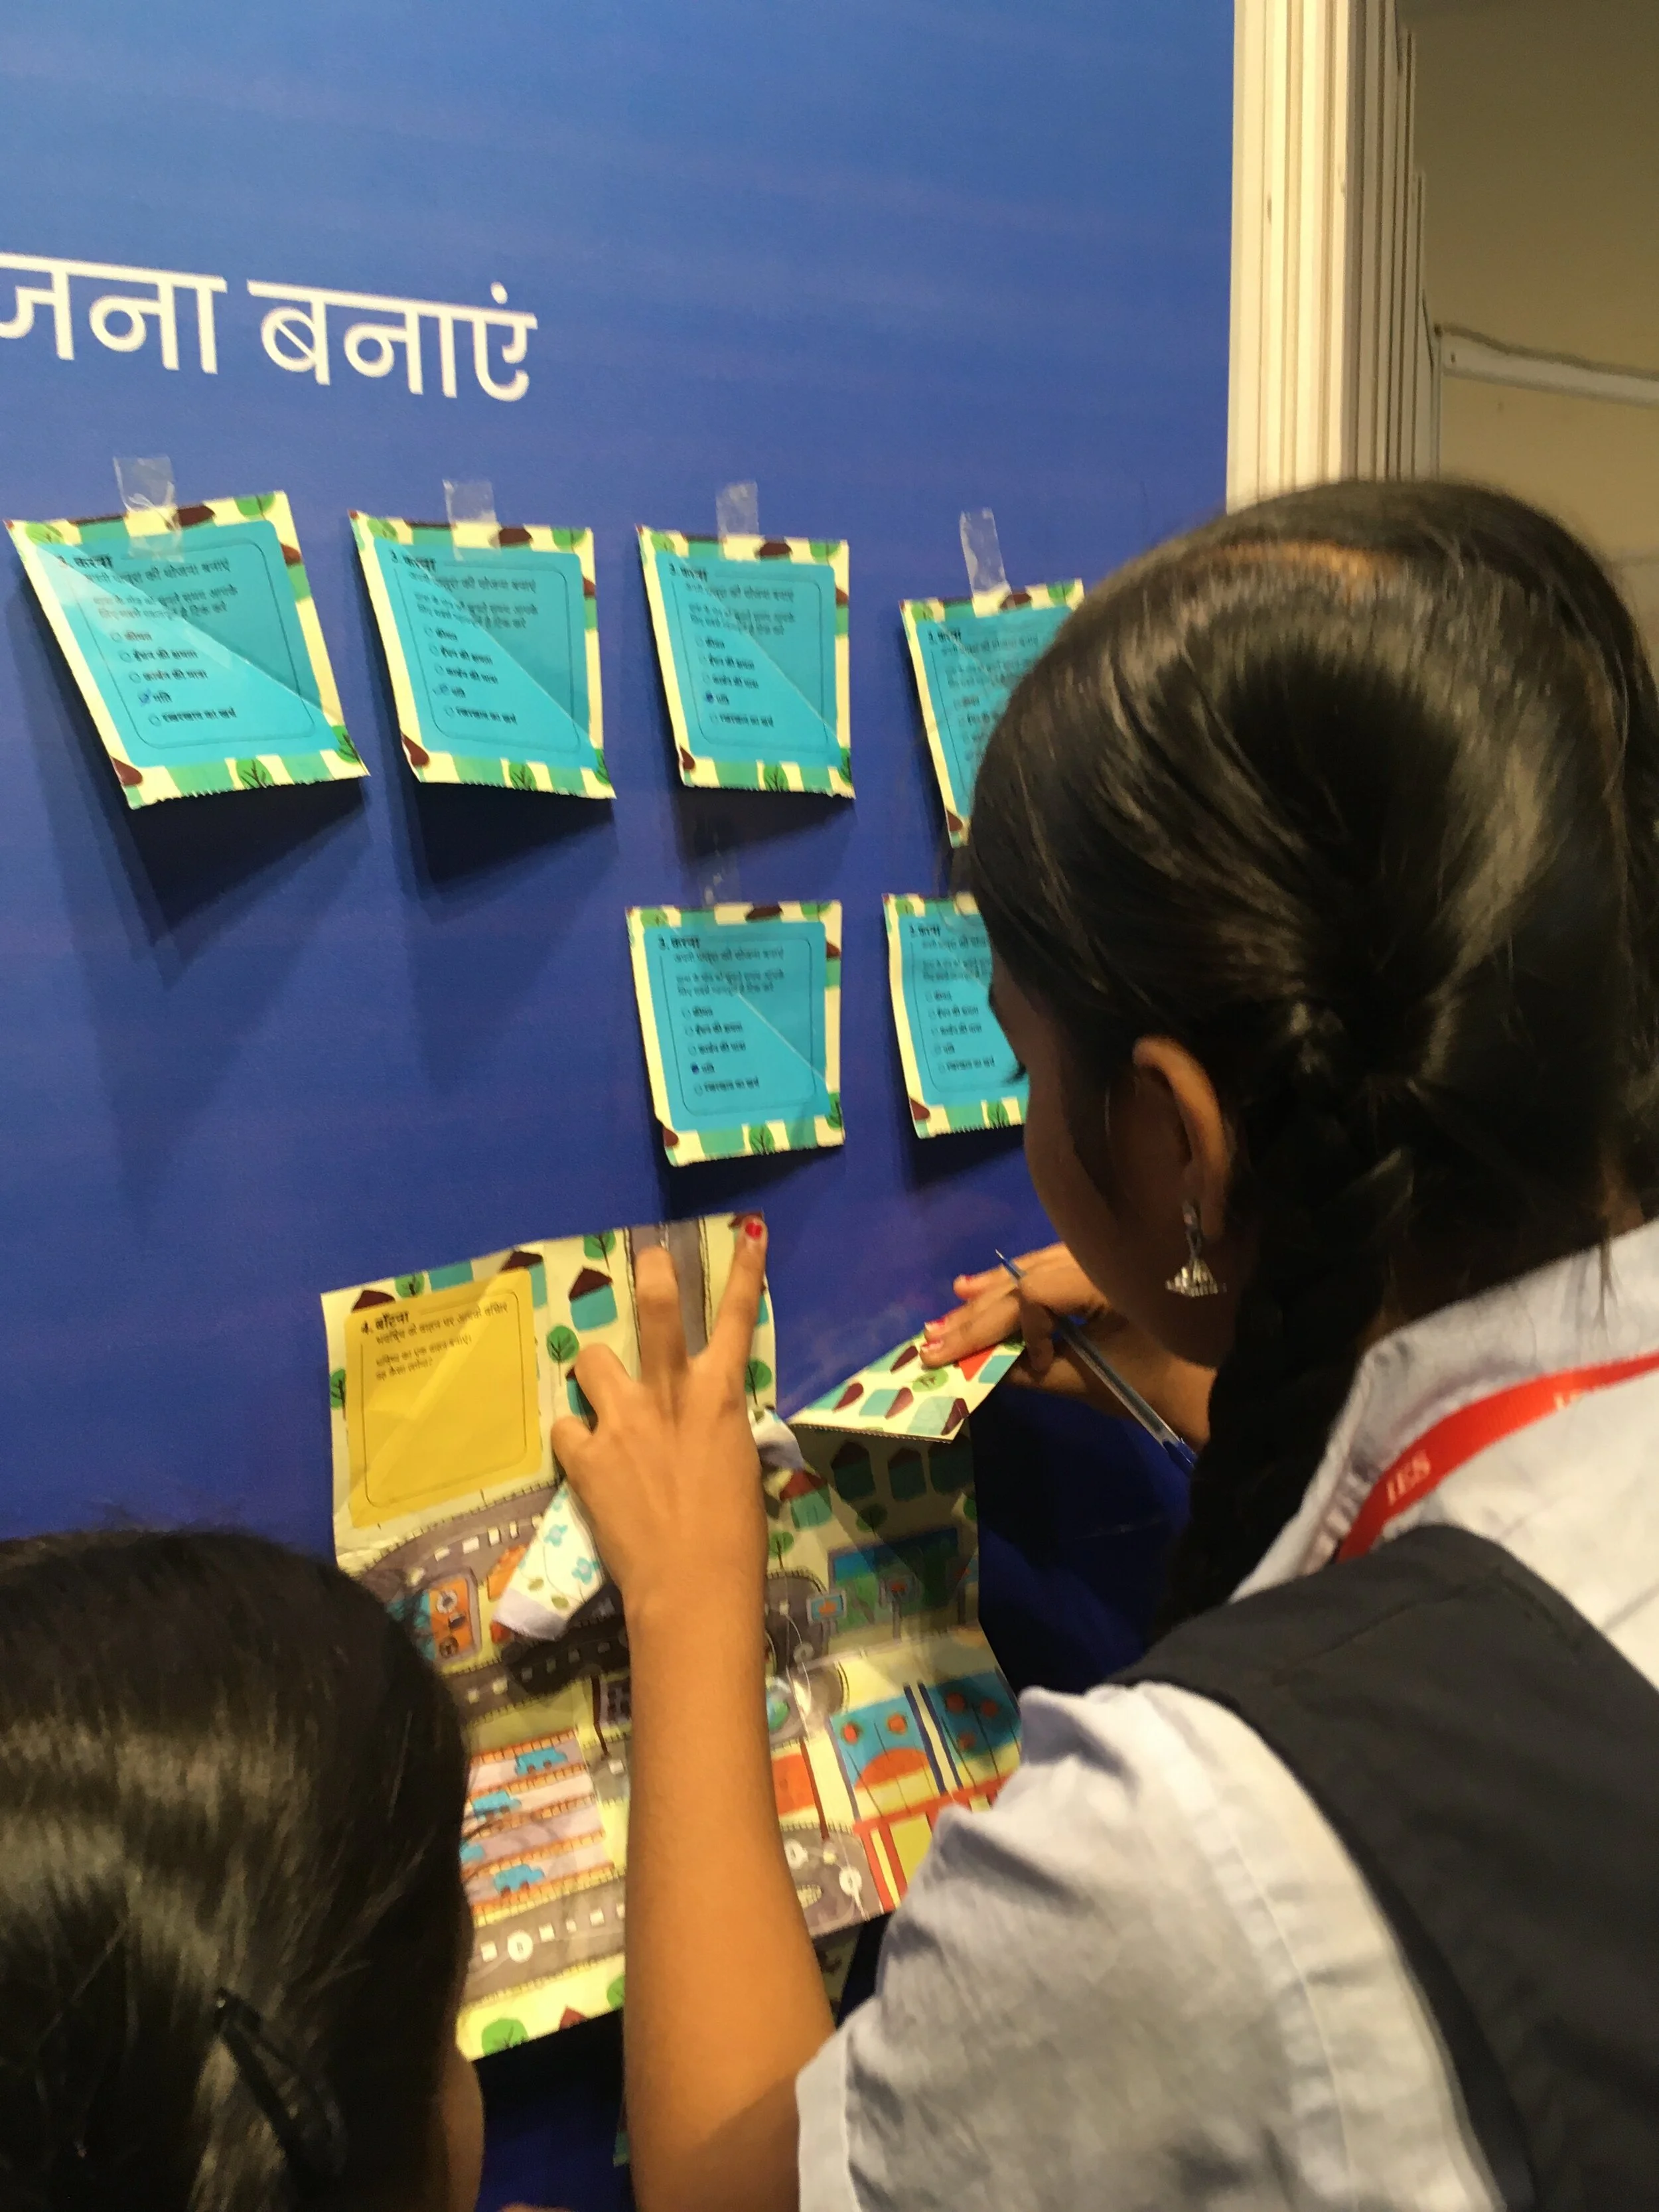
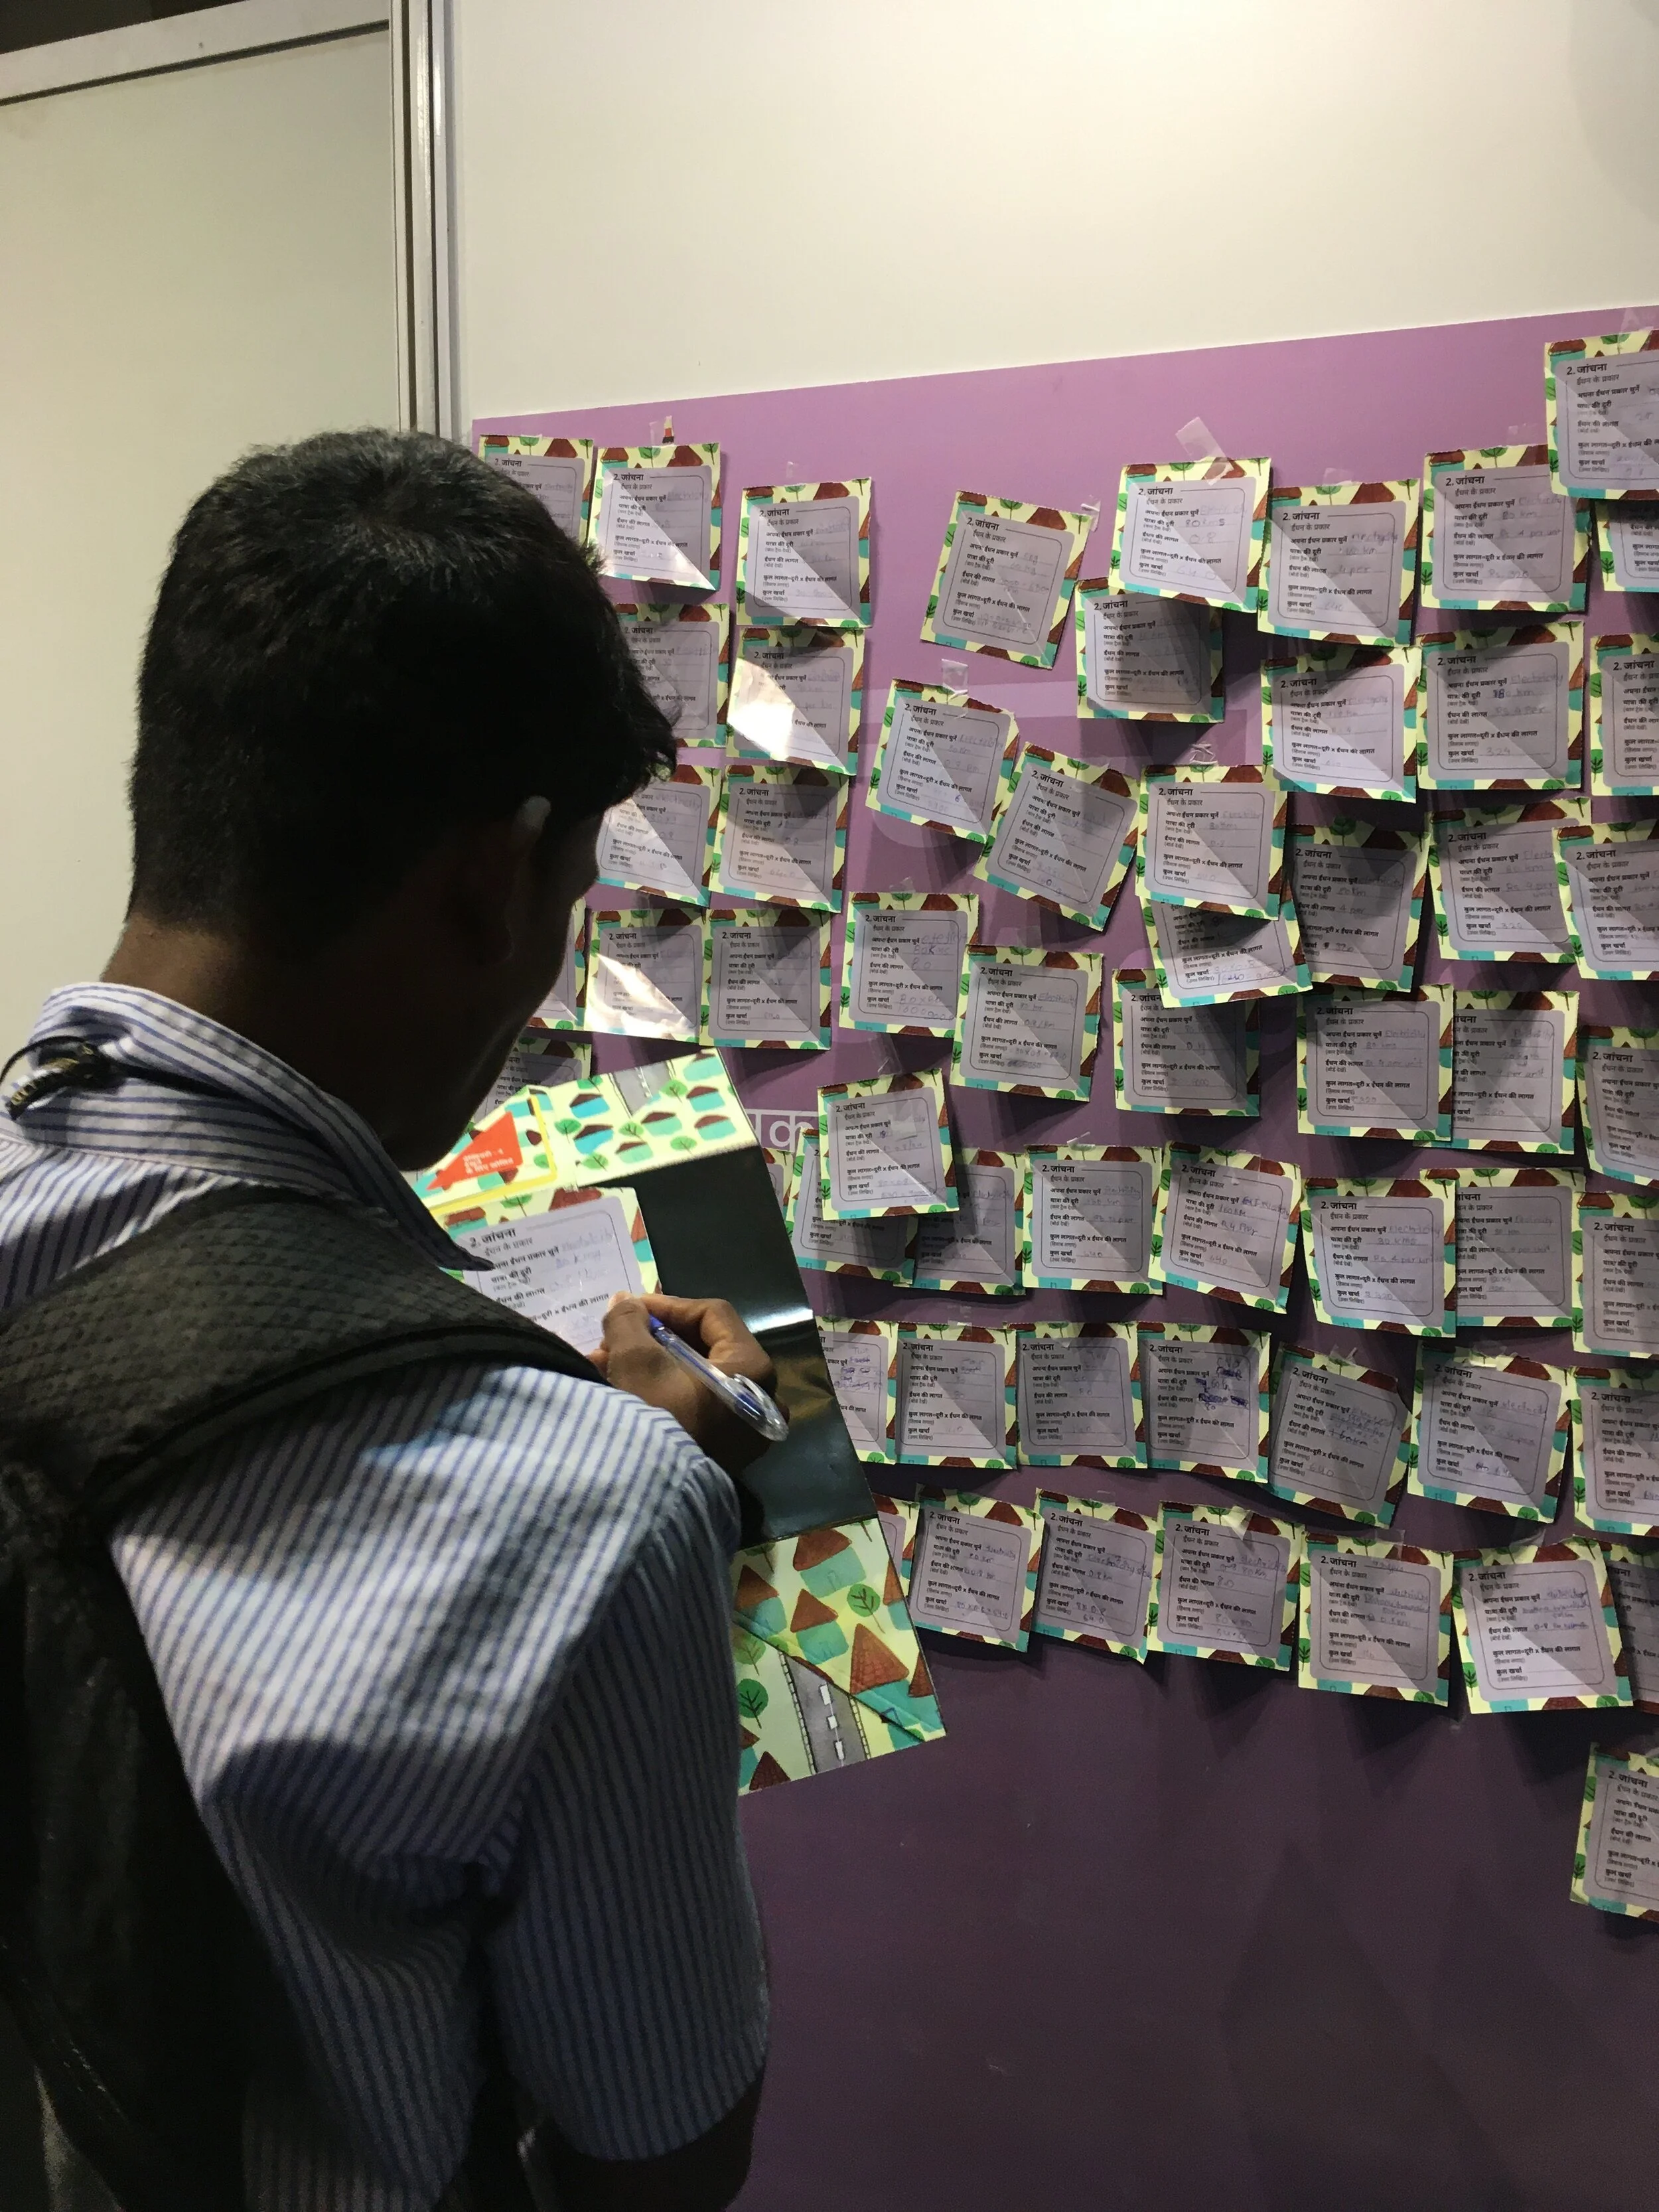
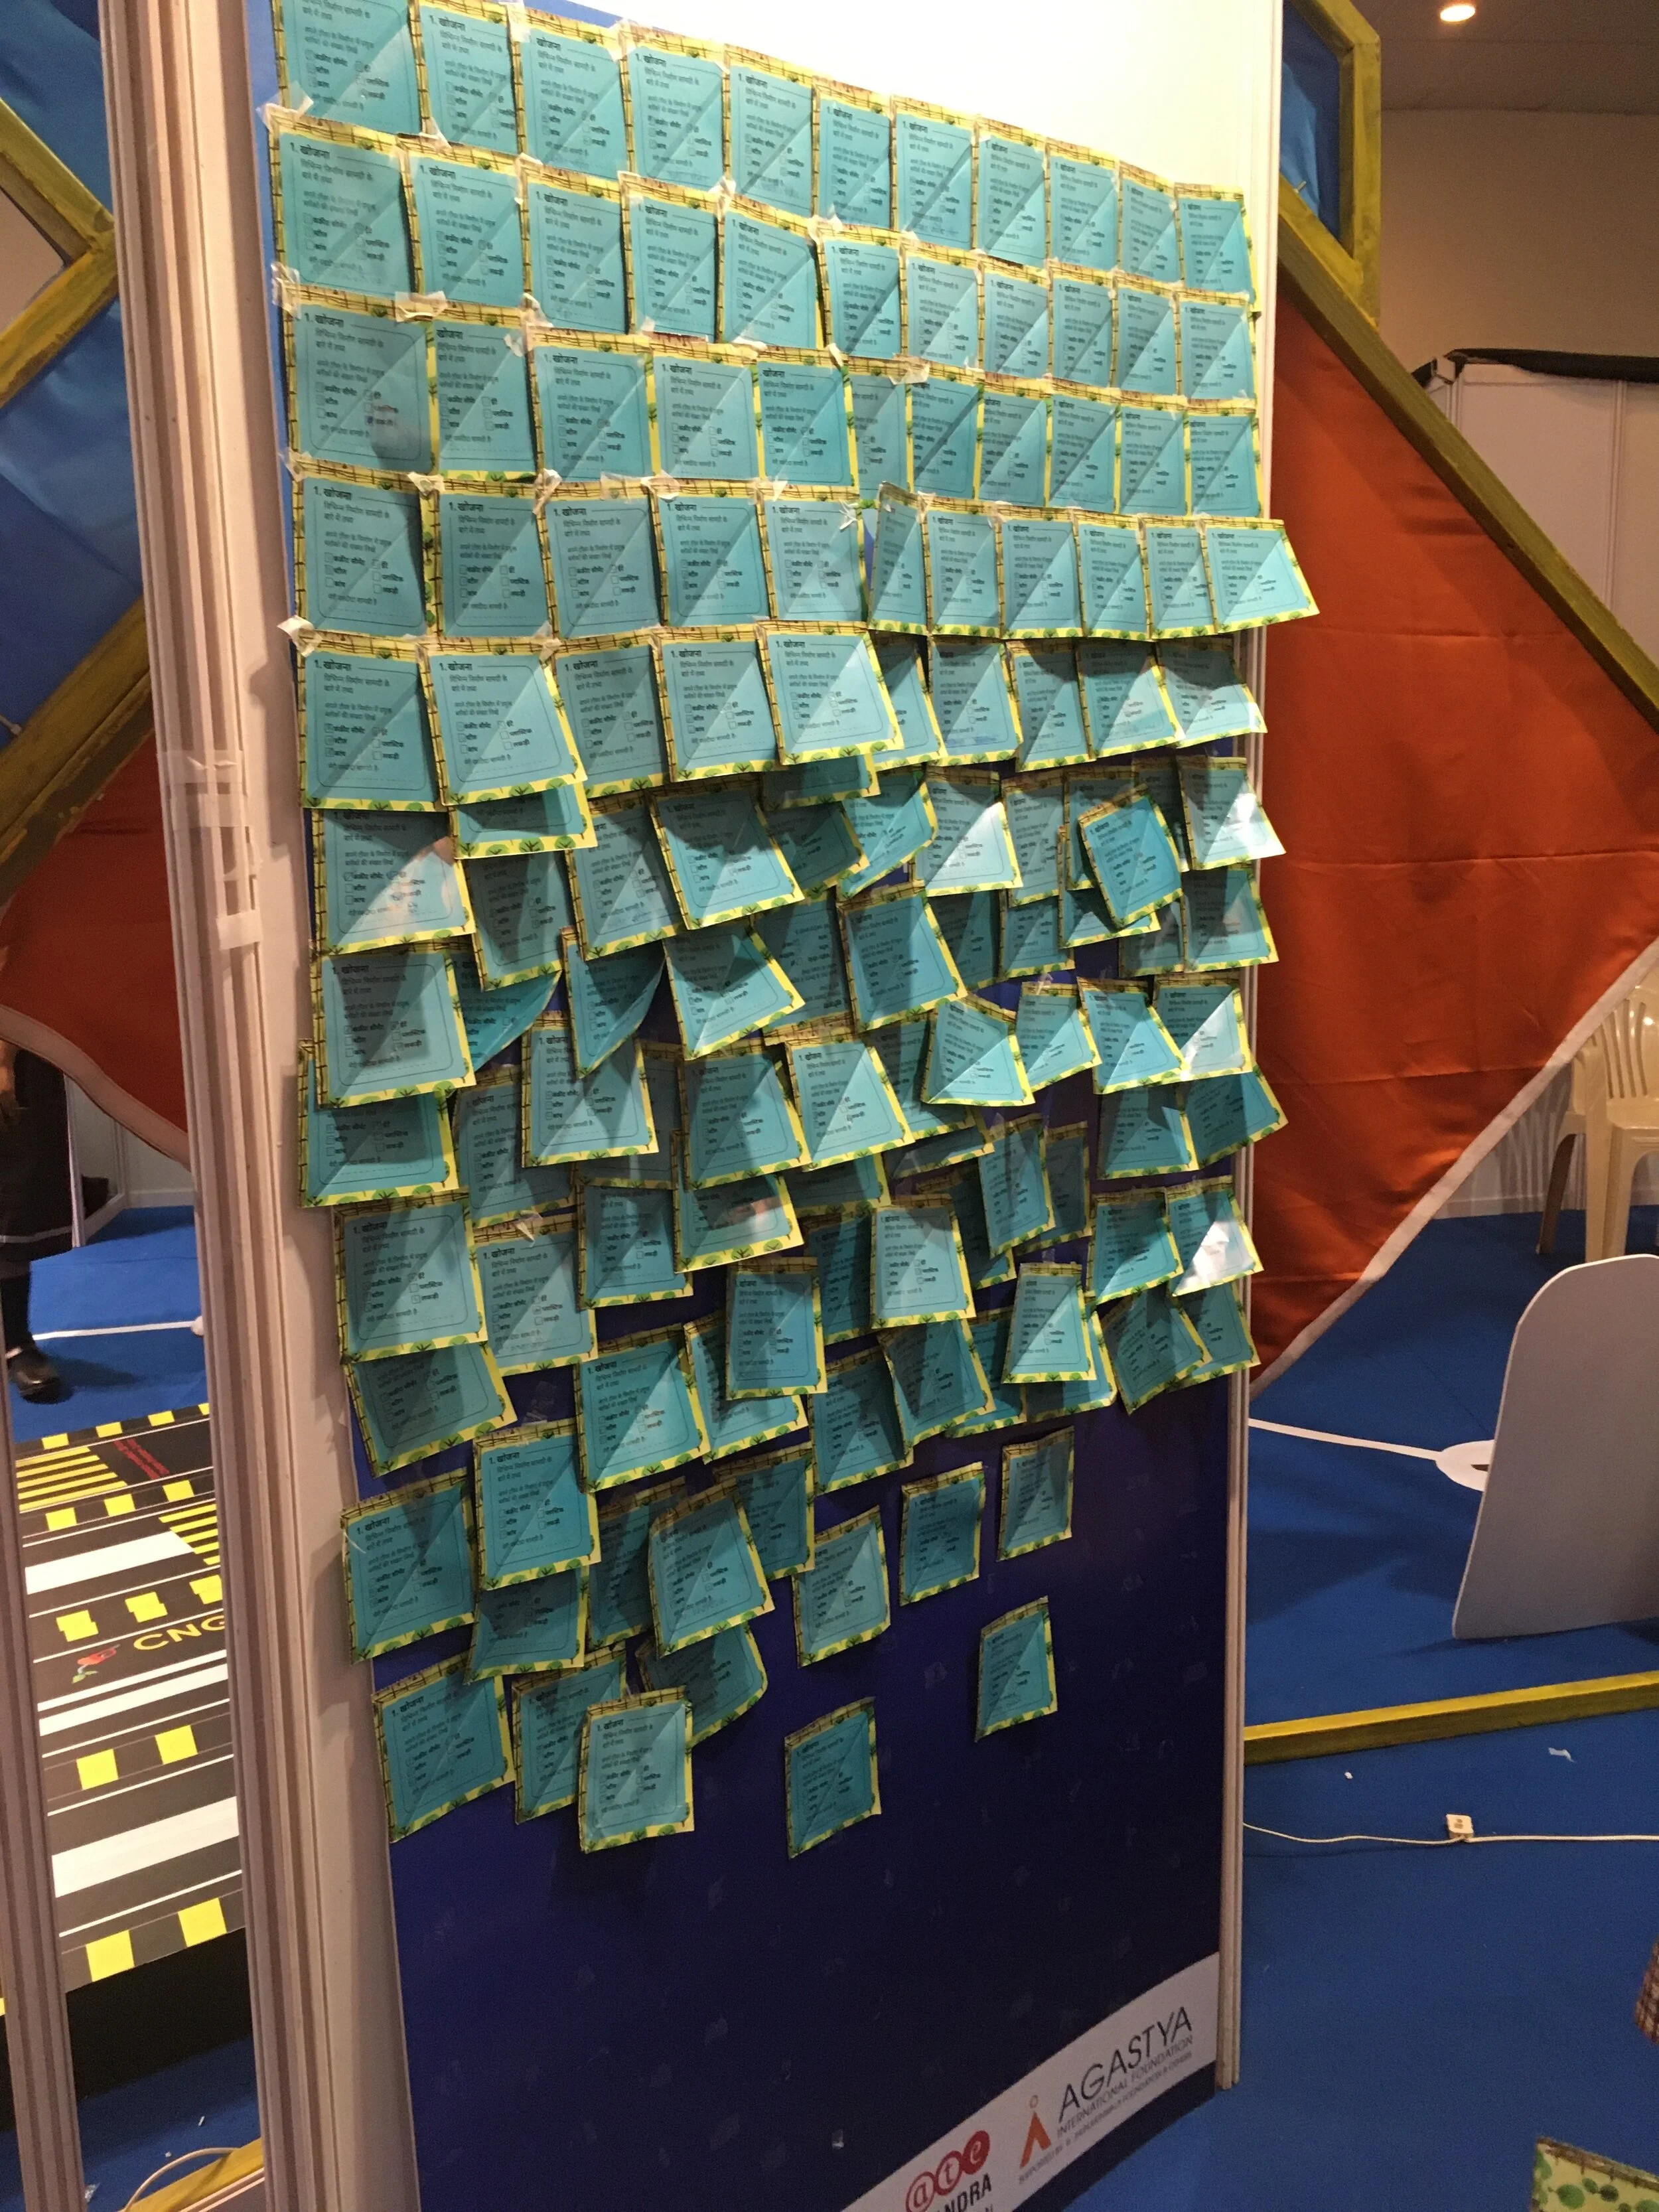
The maps in action
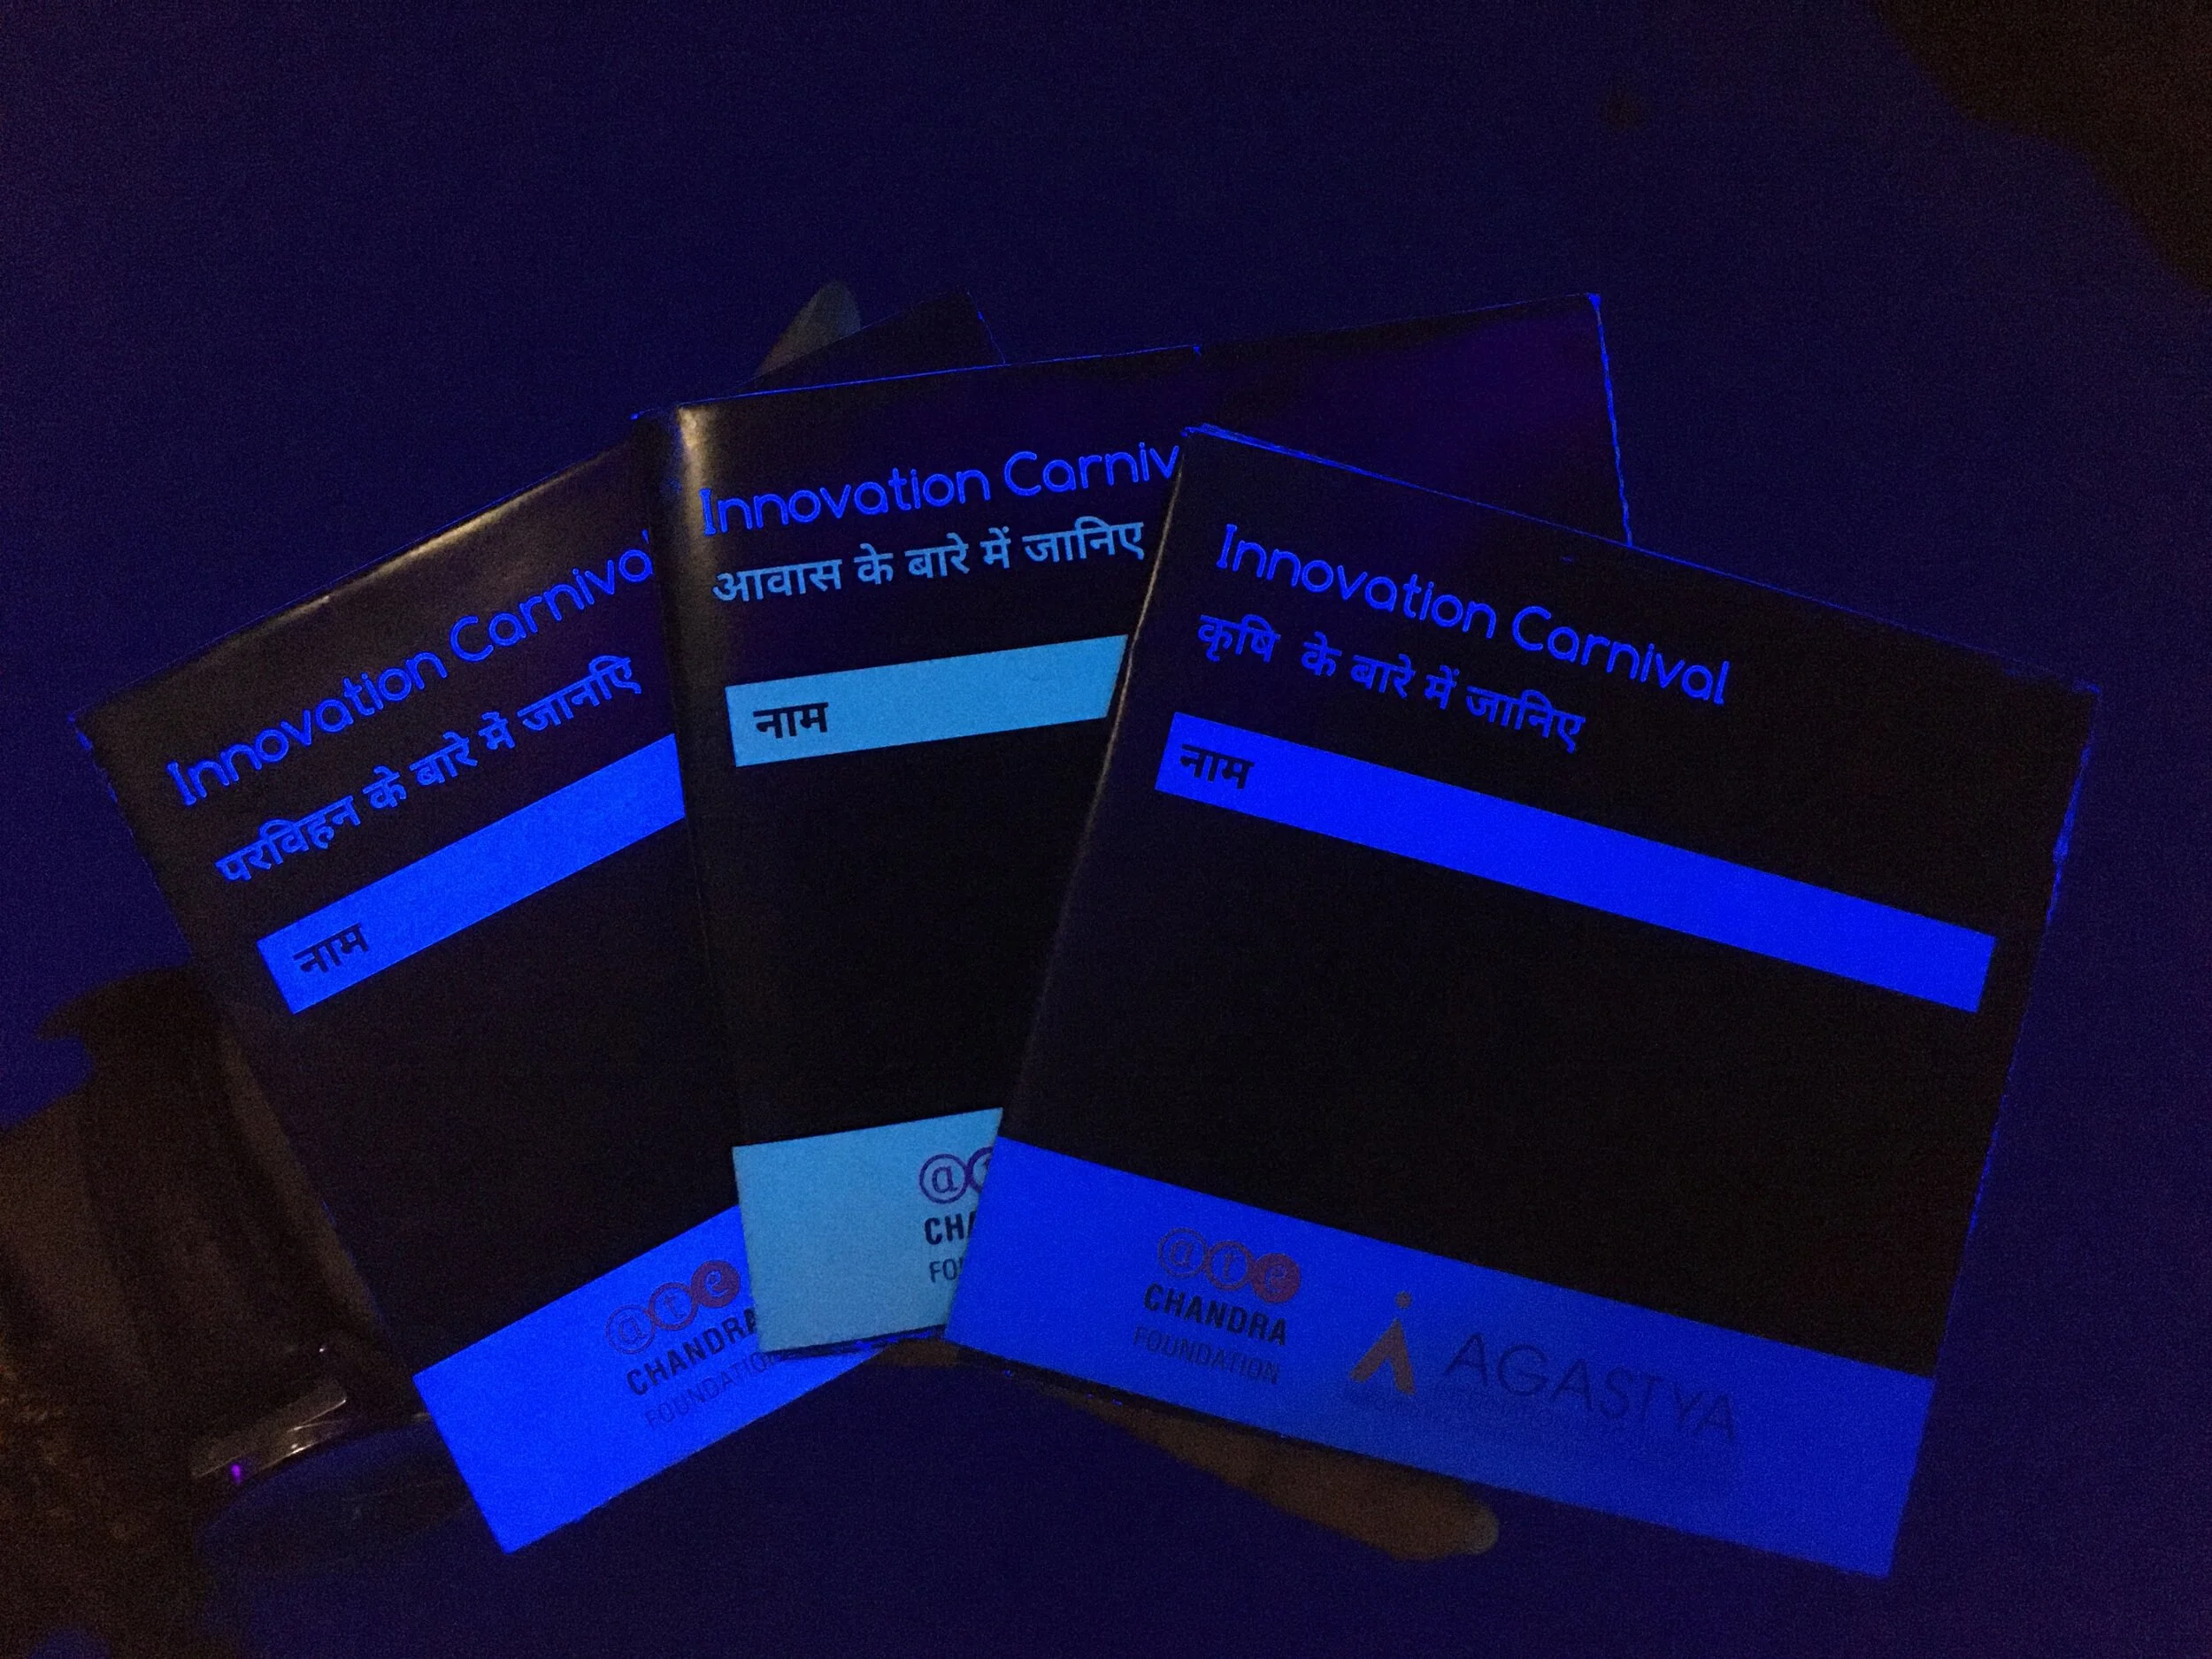
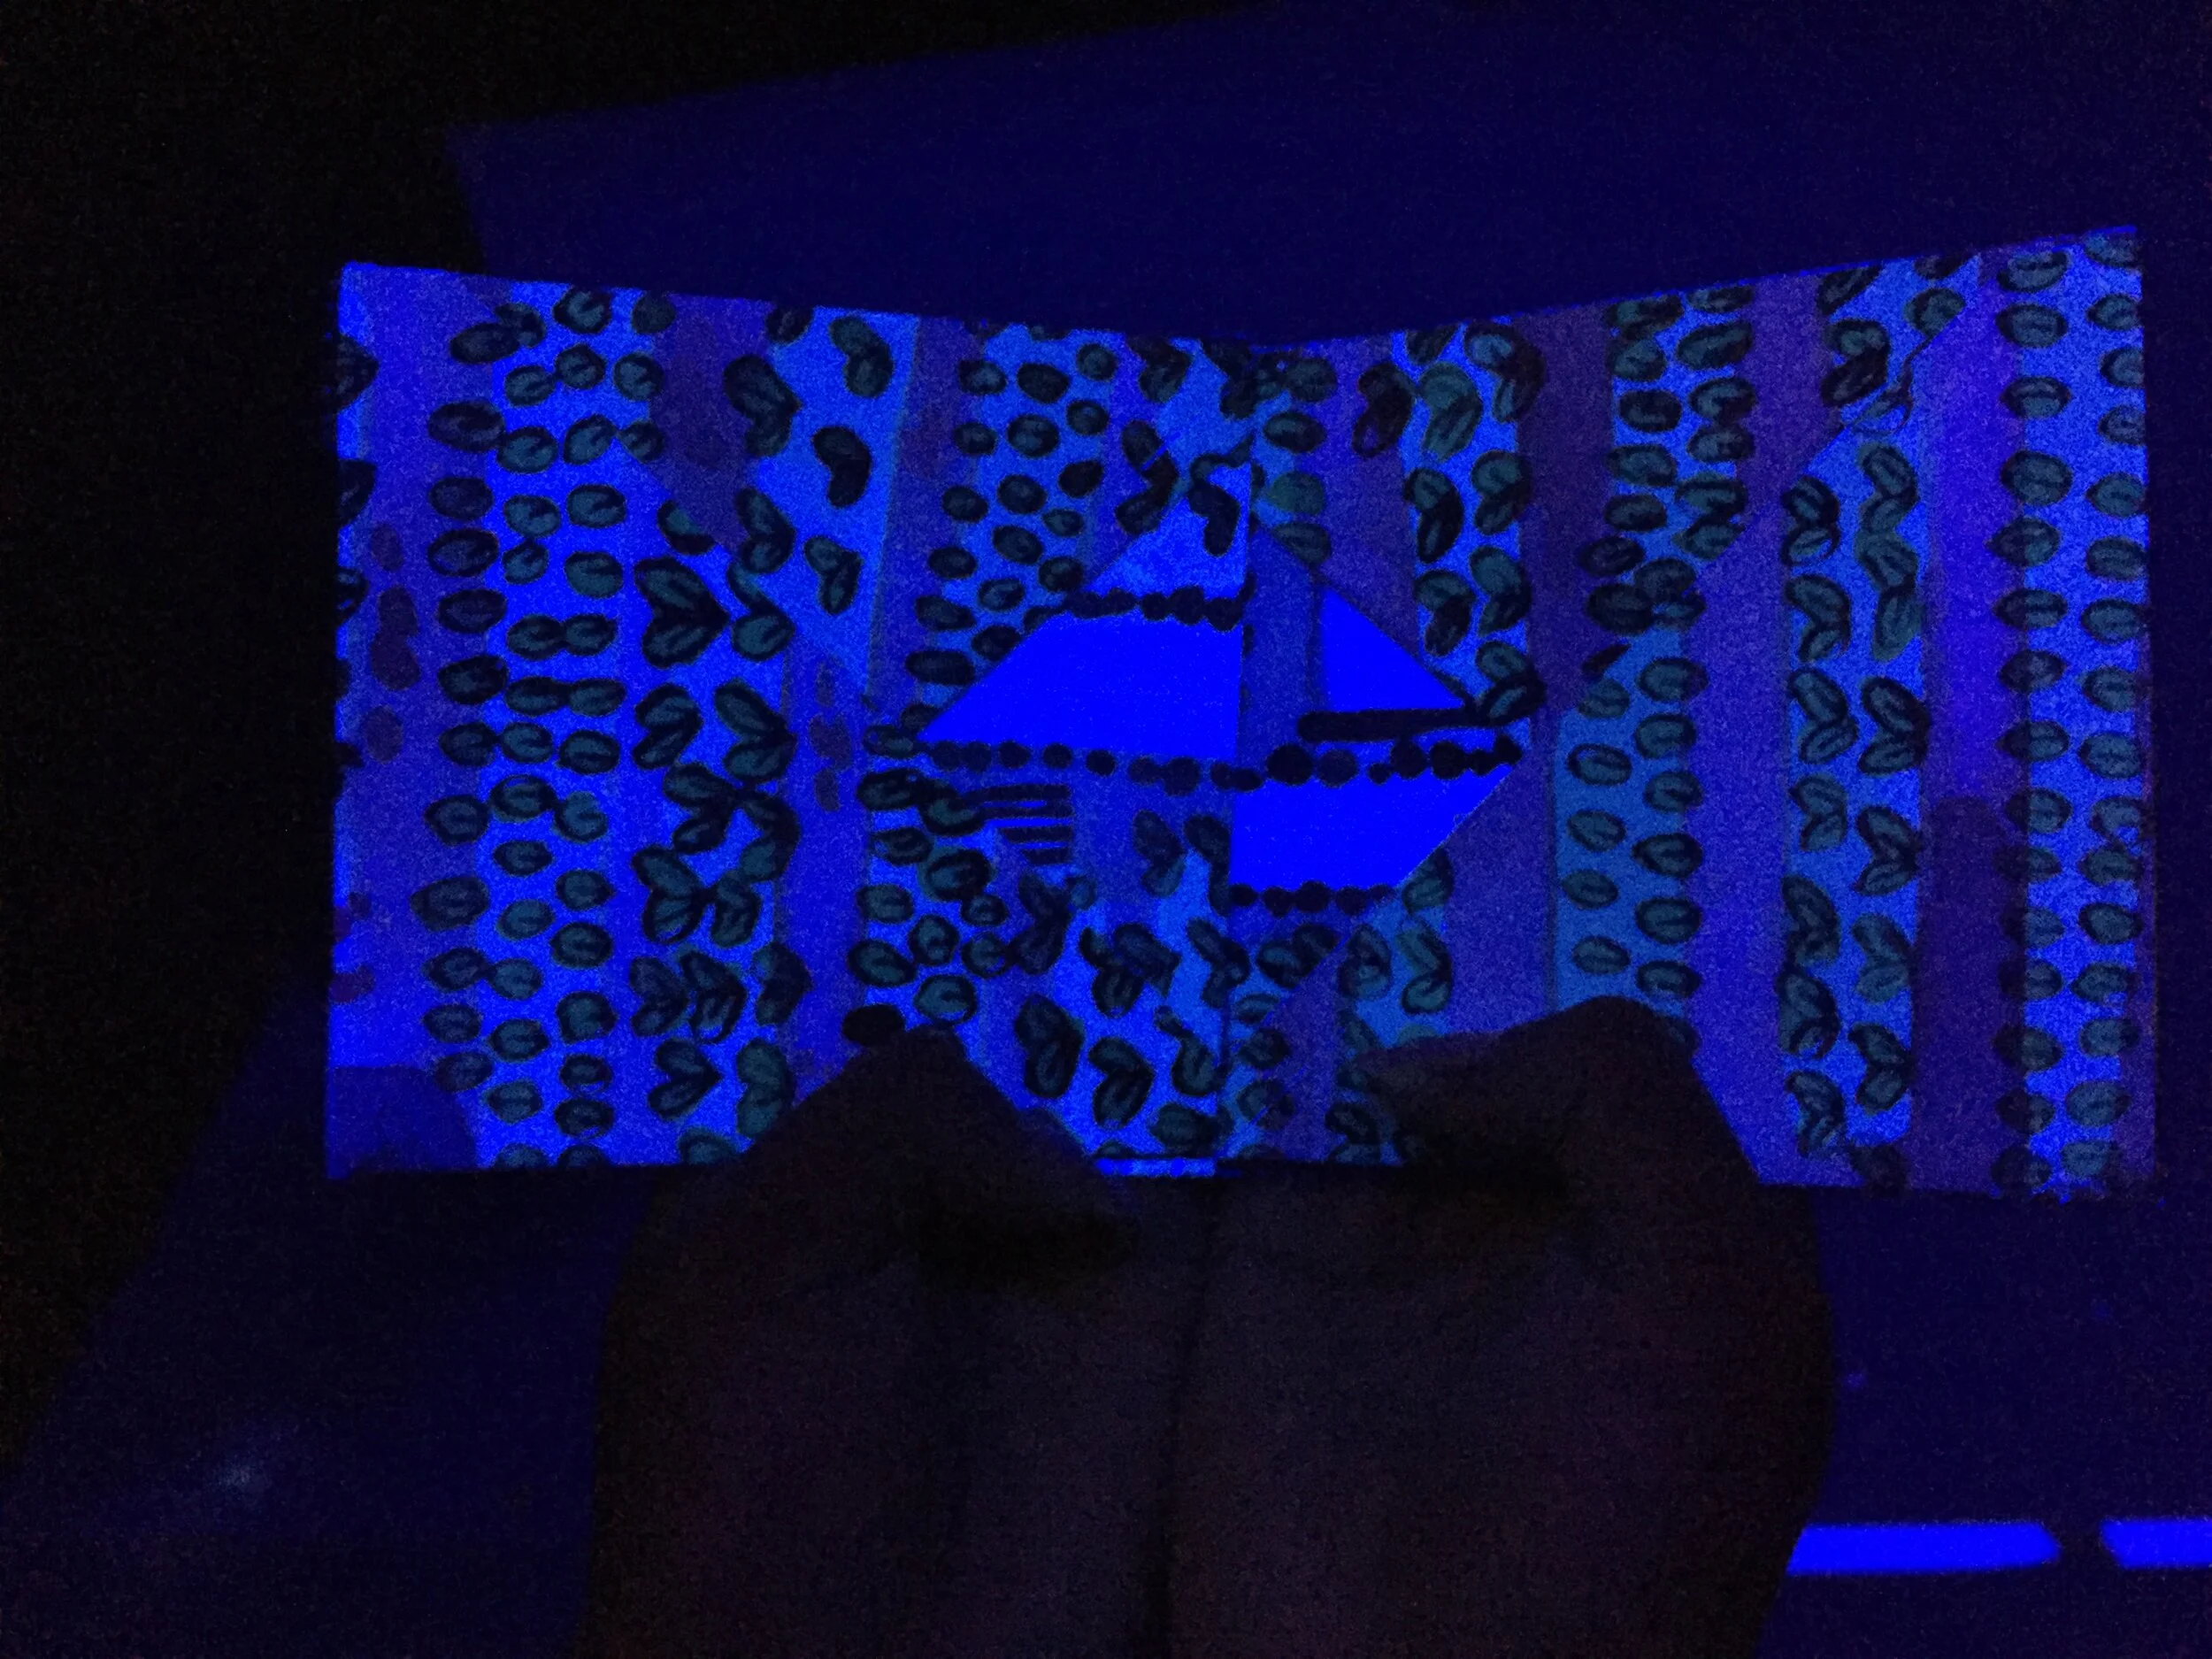
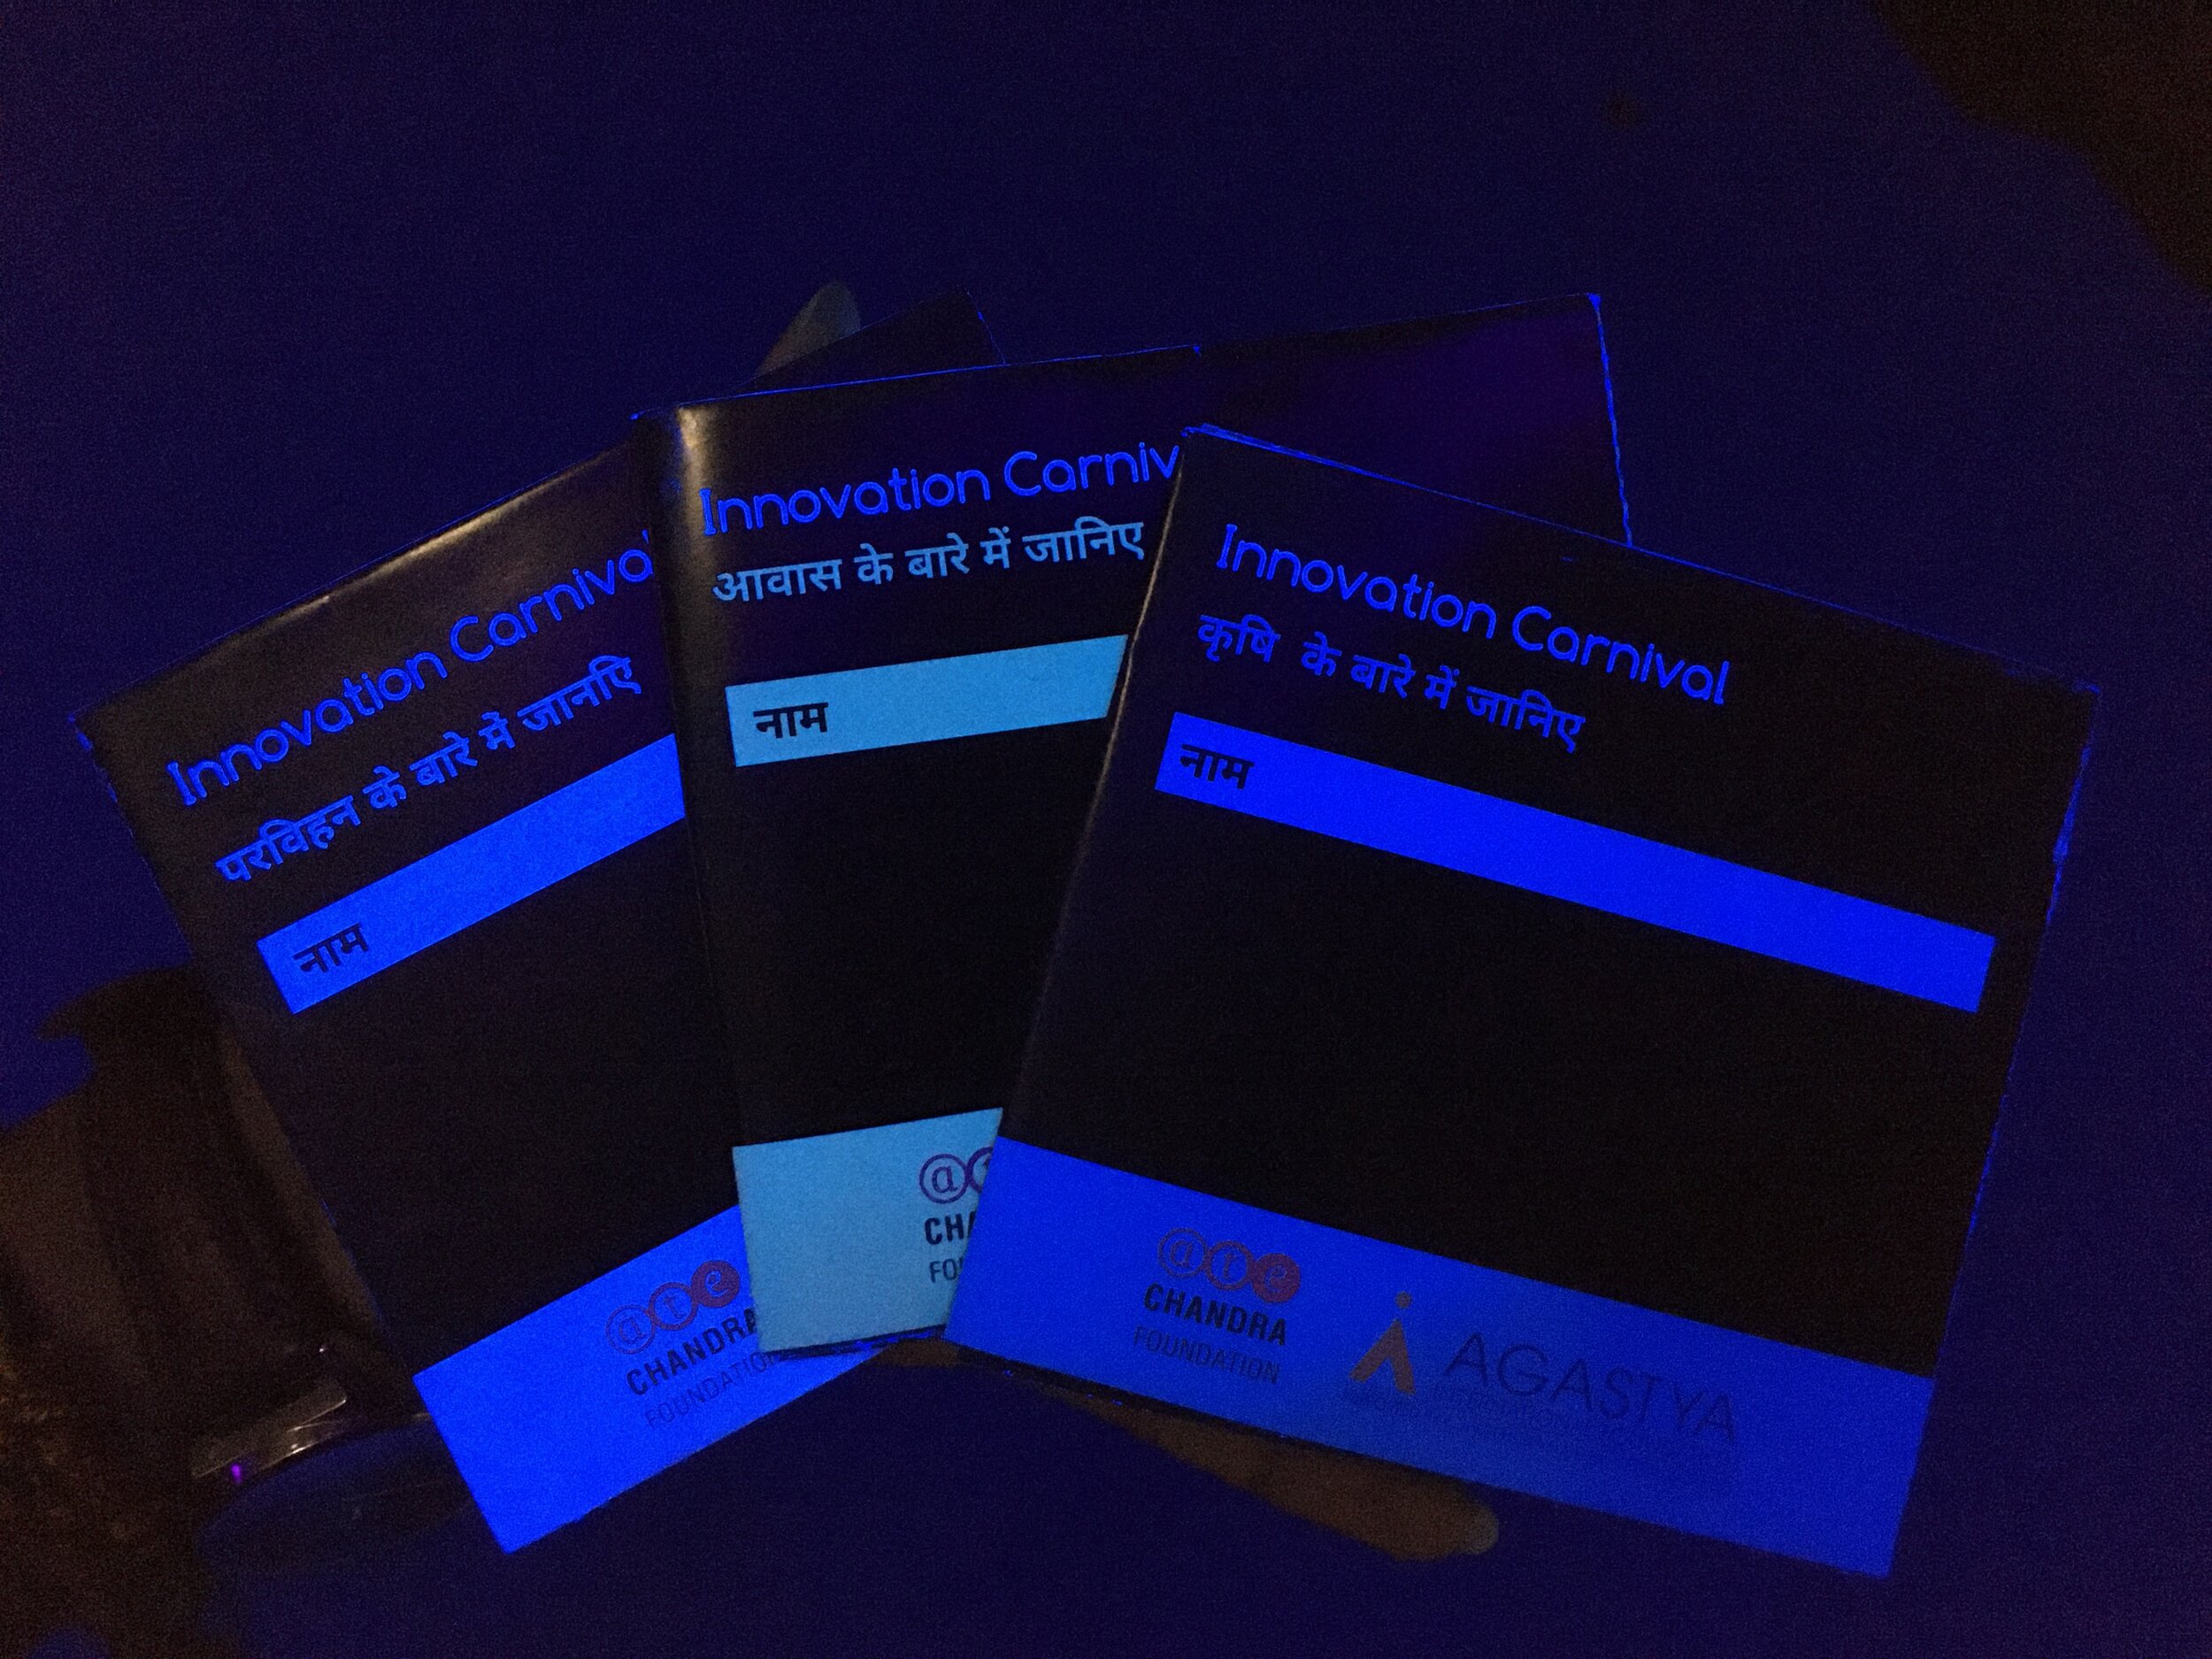
Glow in the dark maps